You can now flag and remove unwanted data from your timeseries directly in Vind AI. You can set conditions on wind speed, wind direction, time of day, and date, across multiple heights. Separate, zoomable charts show your original data, your committed changes, and a live preview, so you can see the effect of every flag before you apply it. This has been one of your most requested features, and this first version is just the start of what we'll build with your feedback.

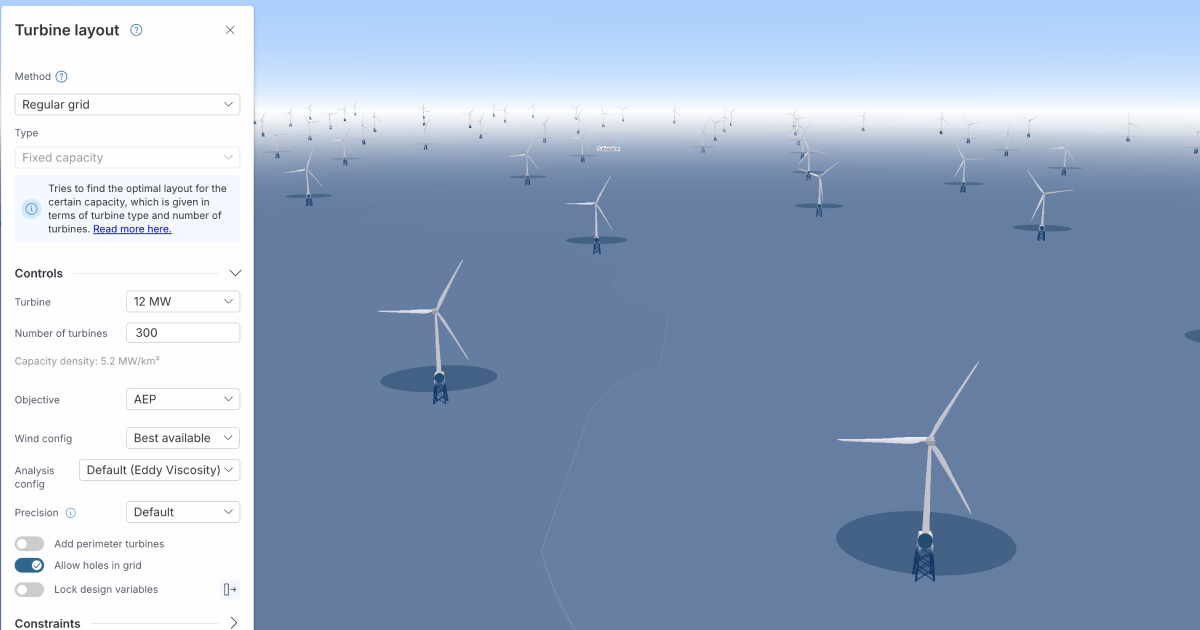
We have improved the performance of our layout optimisation, which now runs significantly faster for large parks. You can also now optimise using Eddy viscosity with the large wind farm correction, which many of you have asked for. There's nothing new to set up: choose an analysis configuration with the correction enabled, and the optimiser takes it into account.
You can now set the commercial operation date (COD) on each park, and your financial configuration adjusts project start and decommissioning relative to that year. This makes your financial configurations far more reusable, because one setup can now serve parks with different timelines. It's a small change in where things live, but it lays the groundwork for more realistic modelling across your portfolio.
You can now combine "has all of", "has none of", and "has any of" when filtering by tags. The numbers page filters and tag filters now sit together in a single panel. Each card in your Portfolio dashboard can also be sorted on its own. Together, these changes make it quicker to find the projects that matter and compare them the way you need.
.png)


Please reach out if you are interested in seeing a demo, asking a question or sharing feedback.


.svg)




.png)