.png)
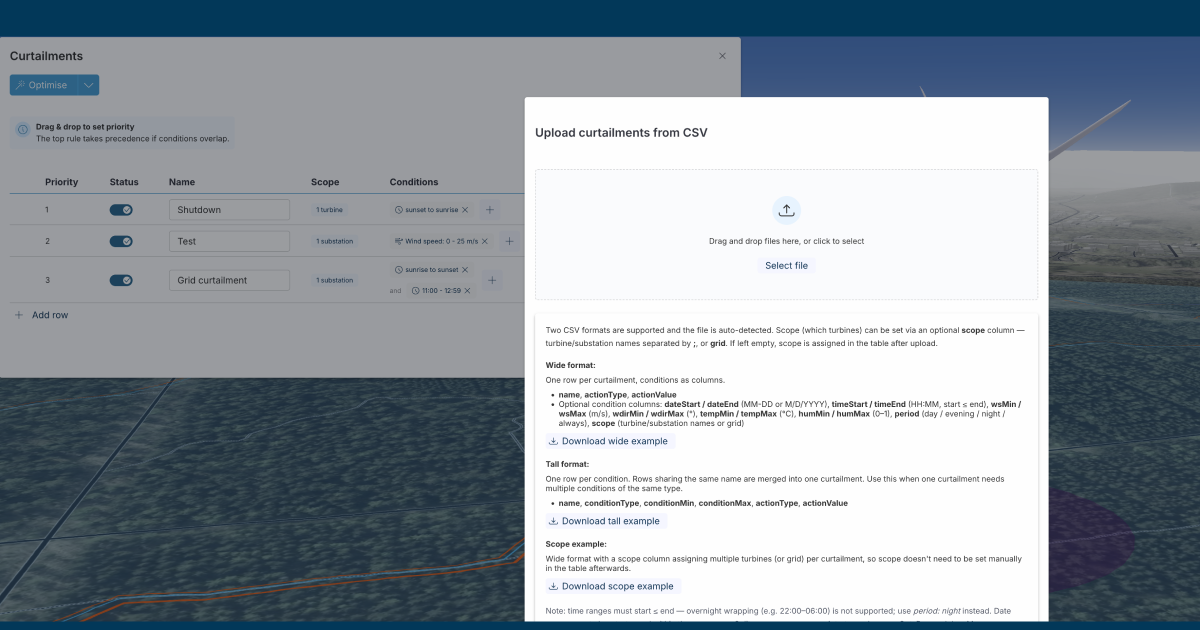
If you already track curtailment schedules in a spreadsheet, you can now upload them directly into Vind AI instead of re-entering them by hand. It's a small change that saves time on projects with complex or pre-defined curtailment strategies, so you can get to analysis sooner.
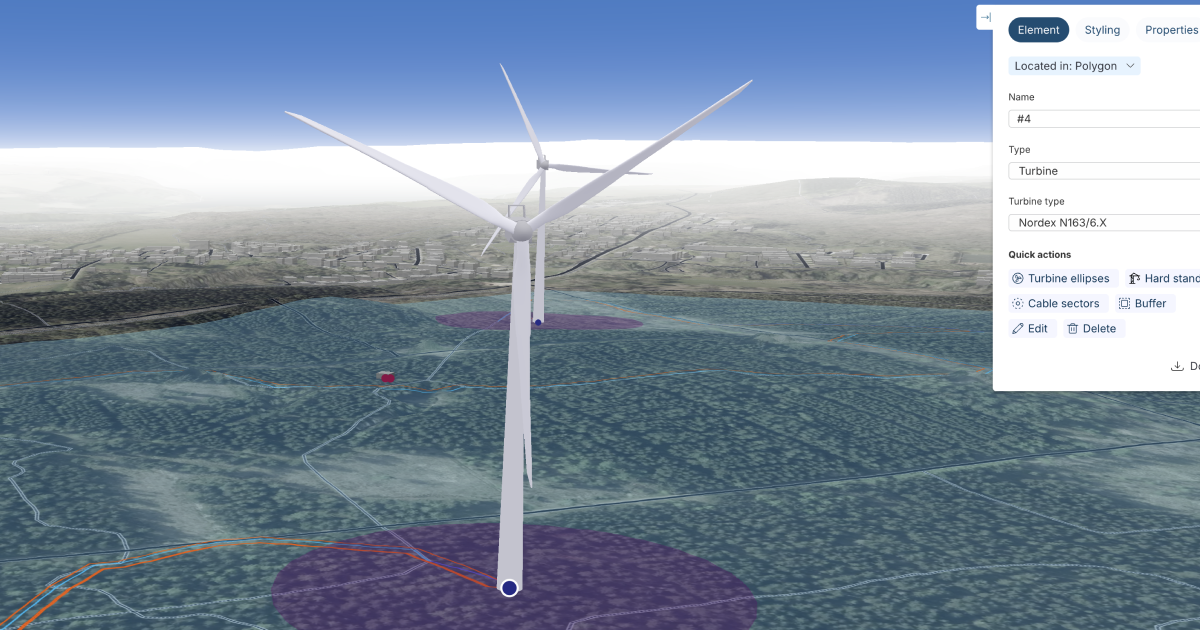
Your solar panels and batteries are now visible in View Park, Photomontage, and in the 3D view of the map. Whether you're preparing stakeholder materials or reviewing a hybrid layout internally, you get one complete, realistic picture of the whole project, not just the wind side of it.
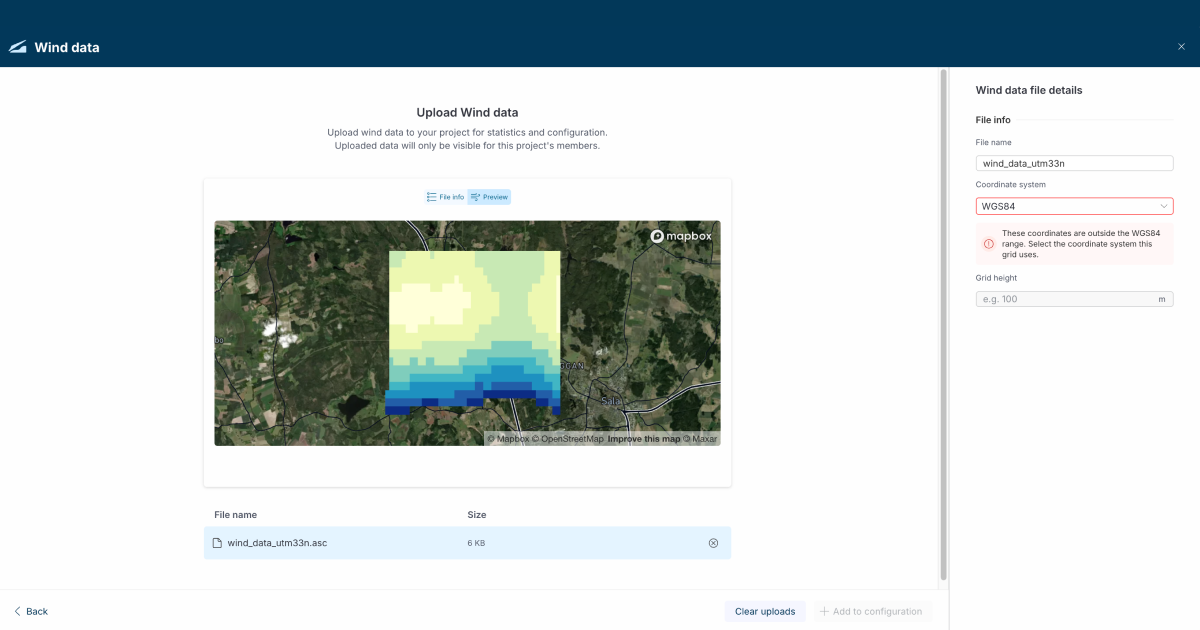
When uploading .asc wind data files, you can now specify which coordinate system the file uses, rather than us assuming WGS84 by default. It's a small change, but it removes a source of silent error: your data is transformed correctly from the start, so your wind resource assessments are built on properly georeferenced input every time.


If you already track curtailment schedules in a spreadsheet, you can now upload them directly into Vind AI instead of re-entering them by hand. It's a small change that saves time on projects with complex or pre-defined curtailment strategies, so you can get to analysis sooner.
Your solar panels and batteries are now visible in View Park, Photomontage, and in the 3D view of the map. Whether you're preparing stakeholder materials or reviewing a hybrid layout internally, you get one complete, realistic picture of the whole project, not just the wind side of it.
When uploading .asc wind data files, you can now specify which coordinate system the file uses, rather than us assuming WGS84 by default. It's a small change, but it removes a source of silent error: your data is transformed correctly from the start, so your wind resource assessments are built on properly georeferenced input every time.
To get the newest product updates, case stories and news releases, sign up for our monthly newsletter.
Please reach out if you are interested in seeing a demo, asking a question or sharing feedback.


.svg)




.png)