
August 10, 2026
Choosing a wind speed data source is one of the first decisions in any wind project and one of the most consequential. It sets the accuracy of your energy estimate, and with it the financial case that decides whether a site moves forward. This guide compares the wind speed data sources that matter for real projects: the global reanalyses ERA5 and MERRA-2, the high-resolution regional datasets CERRA, NORA3, NEWA, BARRA2, and the Global Wind Atlas.
There is no single "best" wind speed data source. Global reanalyses like ERA5 give you a long, consistent record and worldwide coverage but at coarse resolution (~31 km), so they are ideal as a long-term reference rather than a final answer. High-resolution regional datasets such as CERRA (~5.5 km, Europe), NORA3 (~3 km, North Sea and Nordic), NEWA (3 km, purpose-built for wind energy), and BARRA2 (~4.4 km, Australia), capture terrain and coastal effects that global data smooths away. The Global Wind Atlas is best for fast mapping and prospecting, not time-series analysis. The right approach is to layer them: a global reanalysis for the long-term baseline, a high-resolution regional set for local detail, and on-site measurement to correct both.
The wind speed data you choose flows directly into your energy yield, and small errors compound. Because the power available in the wind scales with the cube of wind speed, a modest bias in the input wind speed becomes a much larger swing in predicted annual energy production. That in turn changes your P50 and P90, your LCOE, and the confidence a lender places in the project.
This is why data-source selection is not a quick step early in wind resource assessment — it is a decision that carries all the way through to the business case. Pick a source that misrepresents the local wind climate and you either overpromise (and underperform after construction) or you underrate a good site.
Wind speed data comes in three broad families, and understanding the trade-offs between them is the foundation of every source decision.
Reanalysis blends decades of historical observations into a physics-based weather model to reconstruct a consistent, gap-free record of the atmosphere. ERA5 and MERRA-2 are the two most widely used global datasets. Their strength is a long, continuous time series with worldwide coverage; their weakness is coarse spatial resolution, which averages out terrain, coastlines and local acceleration effects.
Mesoscale datasets take reanalysis and dynamically downscale it to a finer grid, resolving terrain and coastal effects that global models miss. CERRA, NORA3 and NEWA are examples. They trade some geographic breadth for much sharper local detail, the difference between a blurred regional average and a wind field that follows the coastline and the ridges.
Measured data — from met masts, lidar or sodar on the actual site — is the truth every model is ultimately judged against. It is the most accurate representation of a specific location, but it is short (typically one to three years) and expensive. In practice, measurement is combined with a long reanalysis record through measure-correlate-predict (MCP) to produce a long-term, site-specific estimate.
ERA5, the fifth-generation reanalysis from ECMWF, is the de facto global baseline for wind resource work. It provides hourly wind speed and direction at multiple heights on roughly a 0.25° grid (~31 km), with a continuous record from 1940 to near-present. That long, consistent history makes it the standard long-term reference for MCP correction. Its resolution, however, is far too coarse for micrositing — treat ERA5 as your climatological anchor, not your final wind field.
MERRA-2, NASA's global reanalysis, is the main alternative and cross-check to ERA5. It offers hourly data from 1980 to present at roughly 0.5° × 0.625° (~50 km). Because it is produced by a different modelling system, MERRA-2 is valuable for sanity-checking ERA5 in regions where the two disagree, and for its atmospheric and aerosol variables. For most European and offshore work today, engineers lean on ERA5 first and use MERRA-2 as a comparison.
Where global reanalysis smooths the wind, regional datasets sharpen it — and for coastal, offshore and complex-terrain sites that detail is decisive.
None of these replaces on-site measurement, but each brings the local realism that a global reanalysis cannot.
The Global Wind Atlas (GWA) is the fastest way to see mean wind speed almost anywhere on Earth, but it is a mapping tool, not a time series. Developed by DTU with the World Bank, GWA generalises reanalysis through microscale modelling to produce high-resolution maps of mean wind speed and Weibull parameters. It is excellent for early prospecting and site screening or comparing candidate regions at a glance, but because it delivers statistics rather than an hourly record, it cannot drive a full yield assessment on its own.
Match the source to the project stage, not to a favourite dataset. The practitioner's rule is to widen coverage early and sharpen detail as the decision gets more expensive:
Two credible datasets can produce materially different energy estimates for the same site. Consider this example: a site assessed with a high-resolution regional dataset might return an AEP of 100 GWh, while the same site assessed with only a coarse global reanalysis returns 85 GWh. That 15% gap is not a rounding error — it is the difference between a financeable project and a rejected one, and it flows straight into P50, P90 and LCOE. (The numbers here are illustrative; the point is the magnitude of what data choice can shift.)
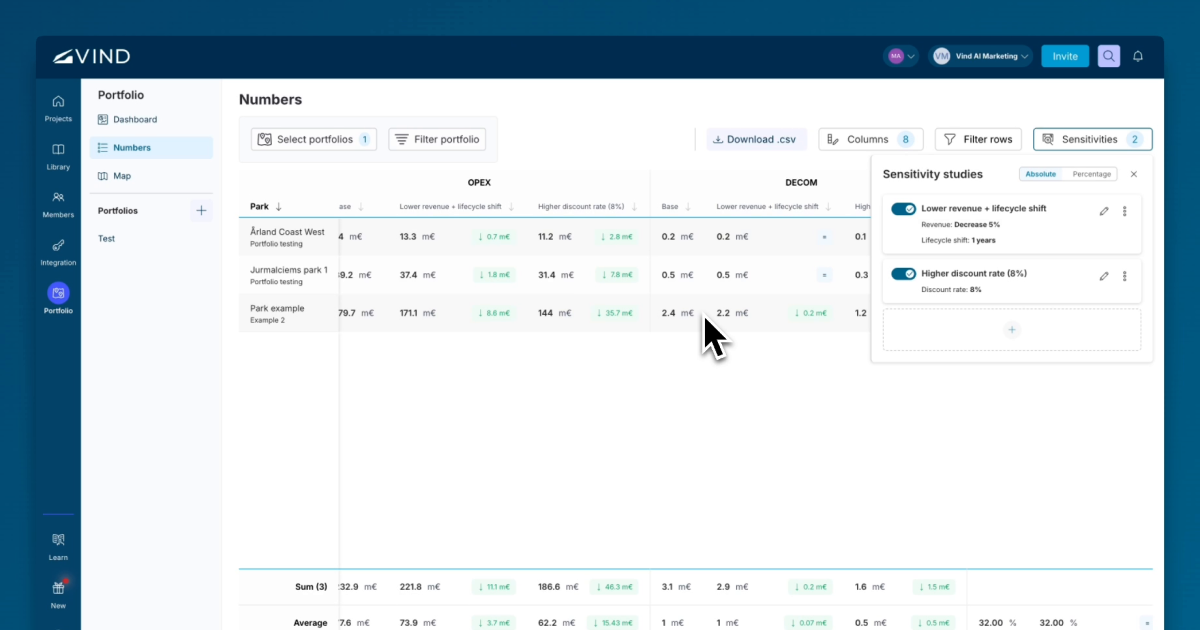
The way to control that risk is not to hunt for one perfect source, but to triangulate: a long global reference for stability, high-resolution regional data for local realism, and measurement to correct both. In Vind AI, you can set up different wind data sources as separate configurations and compare their effect on yield and project economics side by side, so you can see the impact of a data choice before it reaches the business case.
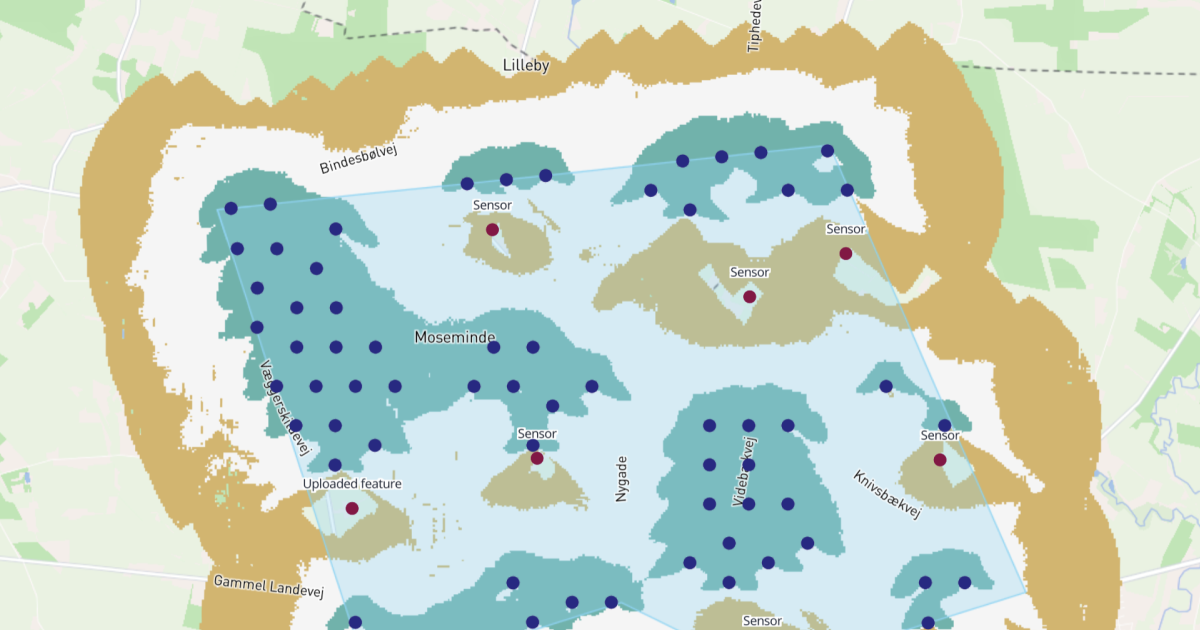
Vind AI is built on the "global coverage with local detail" principle, with ERA5, CERRA, NORA3, and BARRA2 time series, plus the Global Wind Atlas and NEWA integrated directly into the platform. That means you can screen a site anywhere with global data, then switch to high-resolution regional data for the detail, without exporting files between tools or stitching sources together by hand. By default, Vind AI selects the highest-quality dataset available for your site, and you can switch to another source or upload your own at any time. Combined with built-in GIS data and mapping, it turns the layered strategy above into a few clicks rather than a multi-day data exercise.
Answers to common questions about this topic.

Please reach out if you are interested in seeing a demo, asking a question or sharing feedback.