
May 19, 2026
Wind resource assessment (WRA) is the single decision that most determines whether a wind project makes money or loses it — and it is made years before the first turbine is built. This guide walks through the full WRA workflow the way a yield engineer actually runs it: where the data comes from, how short measurement campaigns get stretched into long-term estimates, where the uncertainty hides, and the five mistakes that quietly wreck energy yield predictions. What you won't find in most guides: figures from real developers on how much faster the workflow now runs.
Wind resource assessment estimates how much energy a site will produce over a turbine's lifetime by measuring wind, correlating it to long-term reference data, and modelling flow across the site. Done well, it gives a bankable energy yield with a quantified uncertainty band. Done badly — through wake neglect, weak long-term correlation, or terrain modelling shortcuts — it produces confident numbers that are simply wrong. The work splits into four stages: site selection, data collection, analysis, and uncertainty assessment.
Wind resource assessment is the process of evaluating a site's wind characteristics — primarily wind speed, direction and air density — to estimate how much energy a wind farm will generate over its operating life, ideally using at least one full year of data. It converts raw wind measurements into a long-term energy yield with a defined confidence interval, which is the number lenders, investors and project teams actually decide on.
It is foundational work because nearly every downstream choice depends on it: turbine selection, layout, financing terms and the go/no-go decision itself. A WRA that is 5% optimistic on energy yield can turn a financeable project into one that underperforms its debt schedule for twenty years. This is why "wind resource assessment companies" and in-house yield teams treat it as the analytical backbone of advanced yield assessment, not a box-ticking step.
A wind resource assessment moves through four stages: site selection, data collection, data analysis, and uncertainty quantification. Each stage feeds the next, and a weakness early on propagates into every number downstream.
Site selection identifies locations with promising wind and workable constraints, using wind maps and global datasets for an initial screen before any hardware goes in the ground. At this stage you are filtering on average wind speed, terrain complexity, proximity to grid connection and roads, and environmental or land-use constraints. The goal is to reach a shortlist worth instrumenting — measurement campaigns are expensive, so you screen hard before committing.
Data collection gathers the on-site wind measurements that everything else is calibrated against. Two technologies dominate:
In practice the strongest campaigns use both: a mast for a stable long-term reference and lidar to profile heights the mast can't reach or to cover additional positions across the site.
Data analysis turns raw measurements into a long-term, hub-height yield estimate. The on-site record is usually short — months, not the 20+ years a project needs — so engineers extrapolate it using Measure-Correlate-Predict (MCP), correlating short-term site data against a long-term reference, typically the ERA5 or MERRA-2 reanalysis datasets. The corrected wind distribution is then fitted to a Weibull distribution (the shape parameter k and scale parameter A) so the frequency of every wind speed can be combined with the turbine power curve to compute AEP. Flow modelling — from linear WAsP-type models up to CFD — propagates the measured wind across the site to each turbine position.
Uncertainty quantification attaches an honest confidence band to the yield estimate, and it is the stage amateurs skip. Sources of uncertainty stack up: measurement error from the instruments, the MCP correlation, the flow model, the inter-annual variability of the wind, and the future energy-loss assumptions. A proper analysis quantifies each, combines them, and reports the result as a P50/P90 range. Following MEASNET's evaluation procedure here is what gives lenders the confidence to fund the project.
No single data source is sufficient for a robust wind resource assessment — each trades accuracy against cost, resolution, and deployment speed, so the best campaigns combine them. Reanalysis datasets give you decades of context cheaply; on-site measurement gives you the local truth; flow modelling connects the two across the terrain.
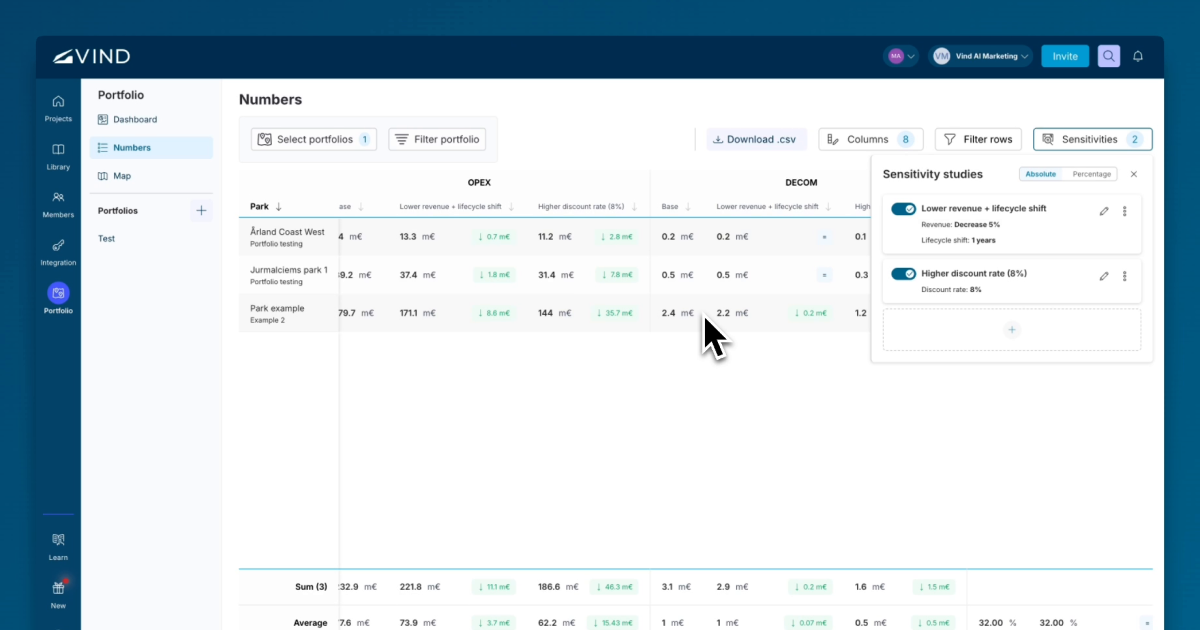
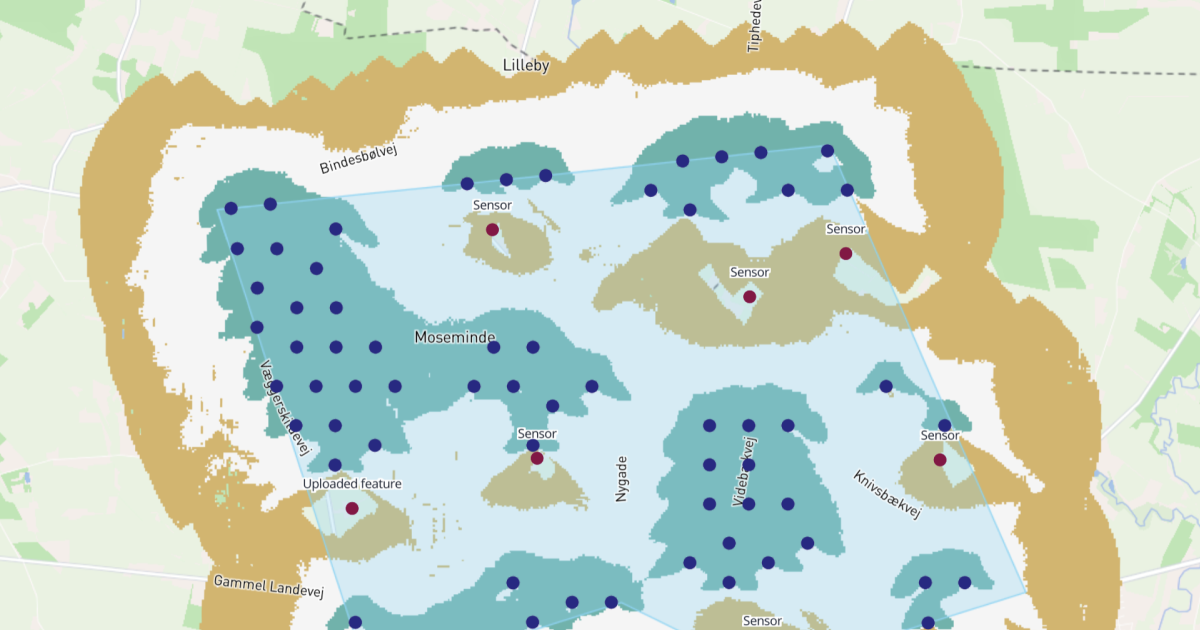
The practical rule: use reanalysis for the long-term picture, on-site hardware for local accuracy, and modelling to spread that accuracy across every turbine location. Tools that hold these layers in one environment — see Vind's advanced yield assessment and GIS data — remove most of the manual stitching between datasets that used to eat days per campaign.
The most damaging WRA errors are not exotic — they are the same five mistakes that recur across projects, flagged here by our engineering team. Each one inflates or deflates yield in ways that survive all the way into the financial model if no one catches them.
Two standards govern credible wind resource assessment: IEC 61400-12-1 for measurement and power-performance, and the MEASNET procedure for site-condition evaluation and uncertainty. Adhering to them is what makes one assessment comparable to another and what lenders and turbine OEMs expect to see.
IEC 61400-12-1 specifies how power-performance measurements are taken, analysed, and reported, which underpins the accuracy of energy-yield predictions. The MEASNET "Evaluation of Site-Specific Wind Conditions" procedure standardises how site wind conditions and their uncertainties are assessed across member labs. If you are commissioning or reviewing a WRA, confirm both are referenced in the report — their absence is a red flag, not a detail.
For engineers running this work day to day, Vind's tooling for wind resource assessment and the workflow built for engineers are designed around these standards rather than bolting them on afterwards.
A wind resource assessment is only as bankable as its weakest stage — and that stage is rarely the analysis, it is the data collection and the honesty of the uncertainty band. The fastest, most defensible path in 2026 is to combine long-term reanalysis with short-term lidar, validate every correlation against an independent reference, and report in P50/P90 terms against IEC and MEASNET standards. If you want to see how that full workflow runs in one environment, book a demo of Vind's wind resource assessment platform.
Answers to common questions about this topic.

Please reach out if you are interested in seeing a demo, asking a question or sharing feedback.