This time of year is always a busy time for us, so we are excited to share several updates on product, events, and that we now have recordings for a few of our most-watched webinars.
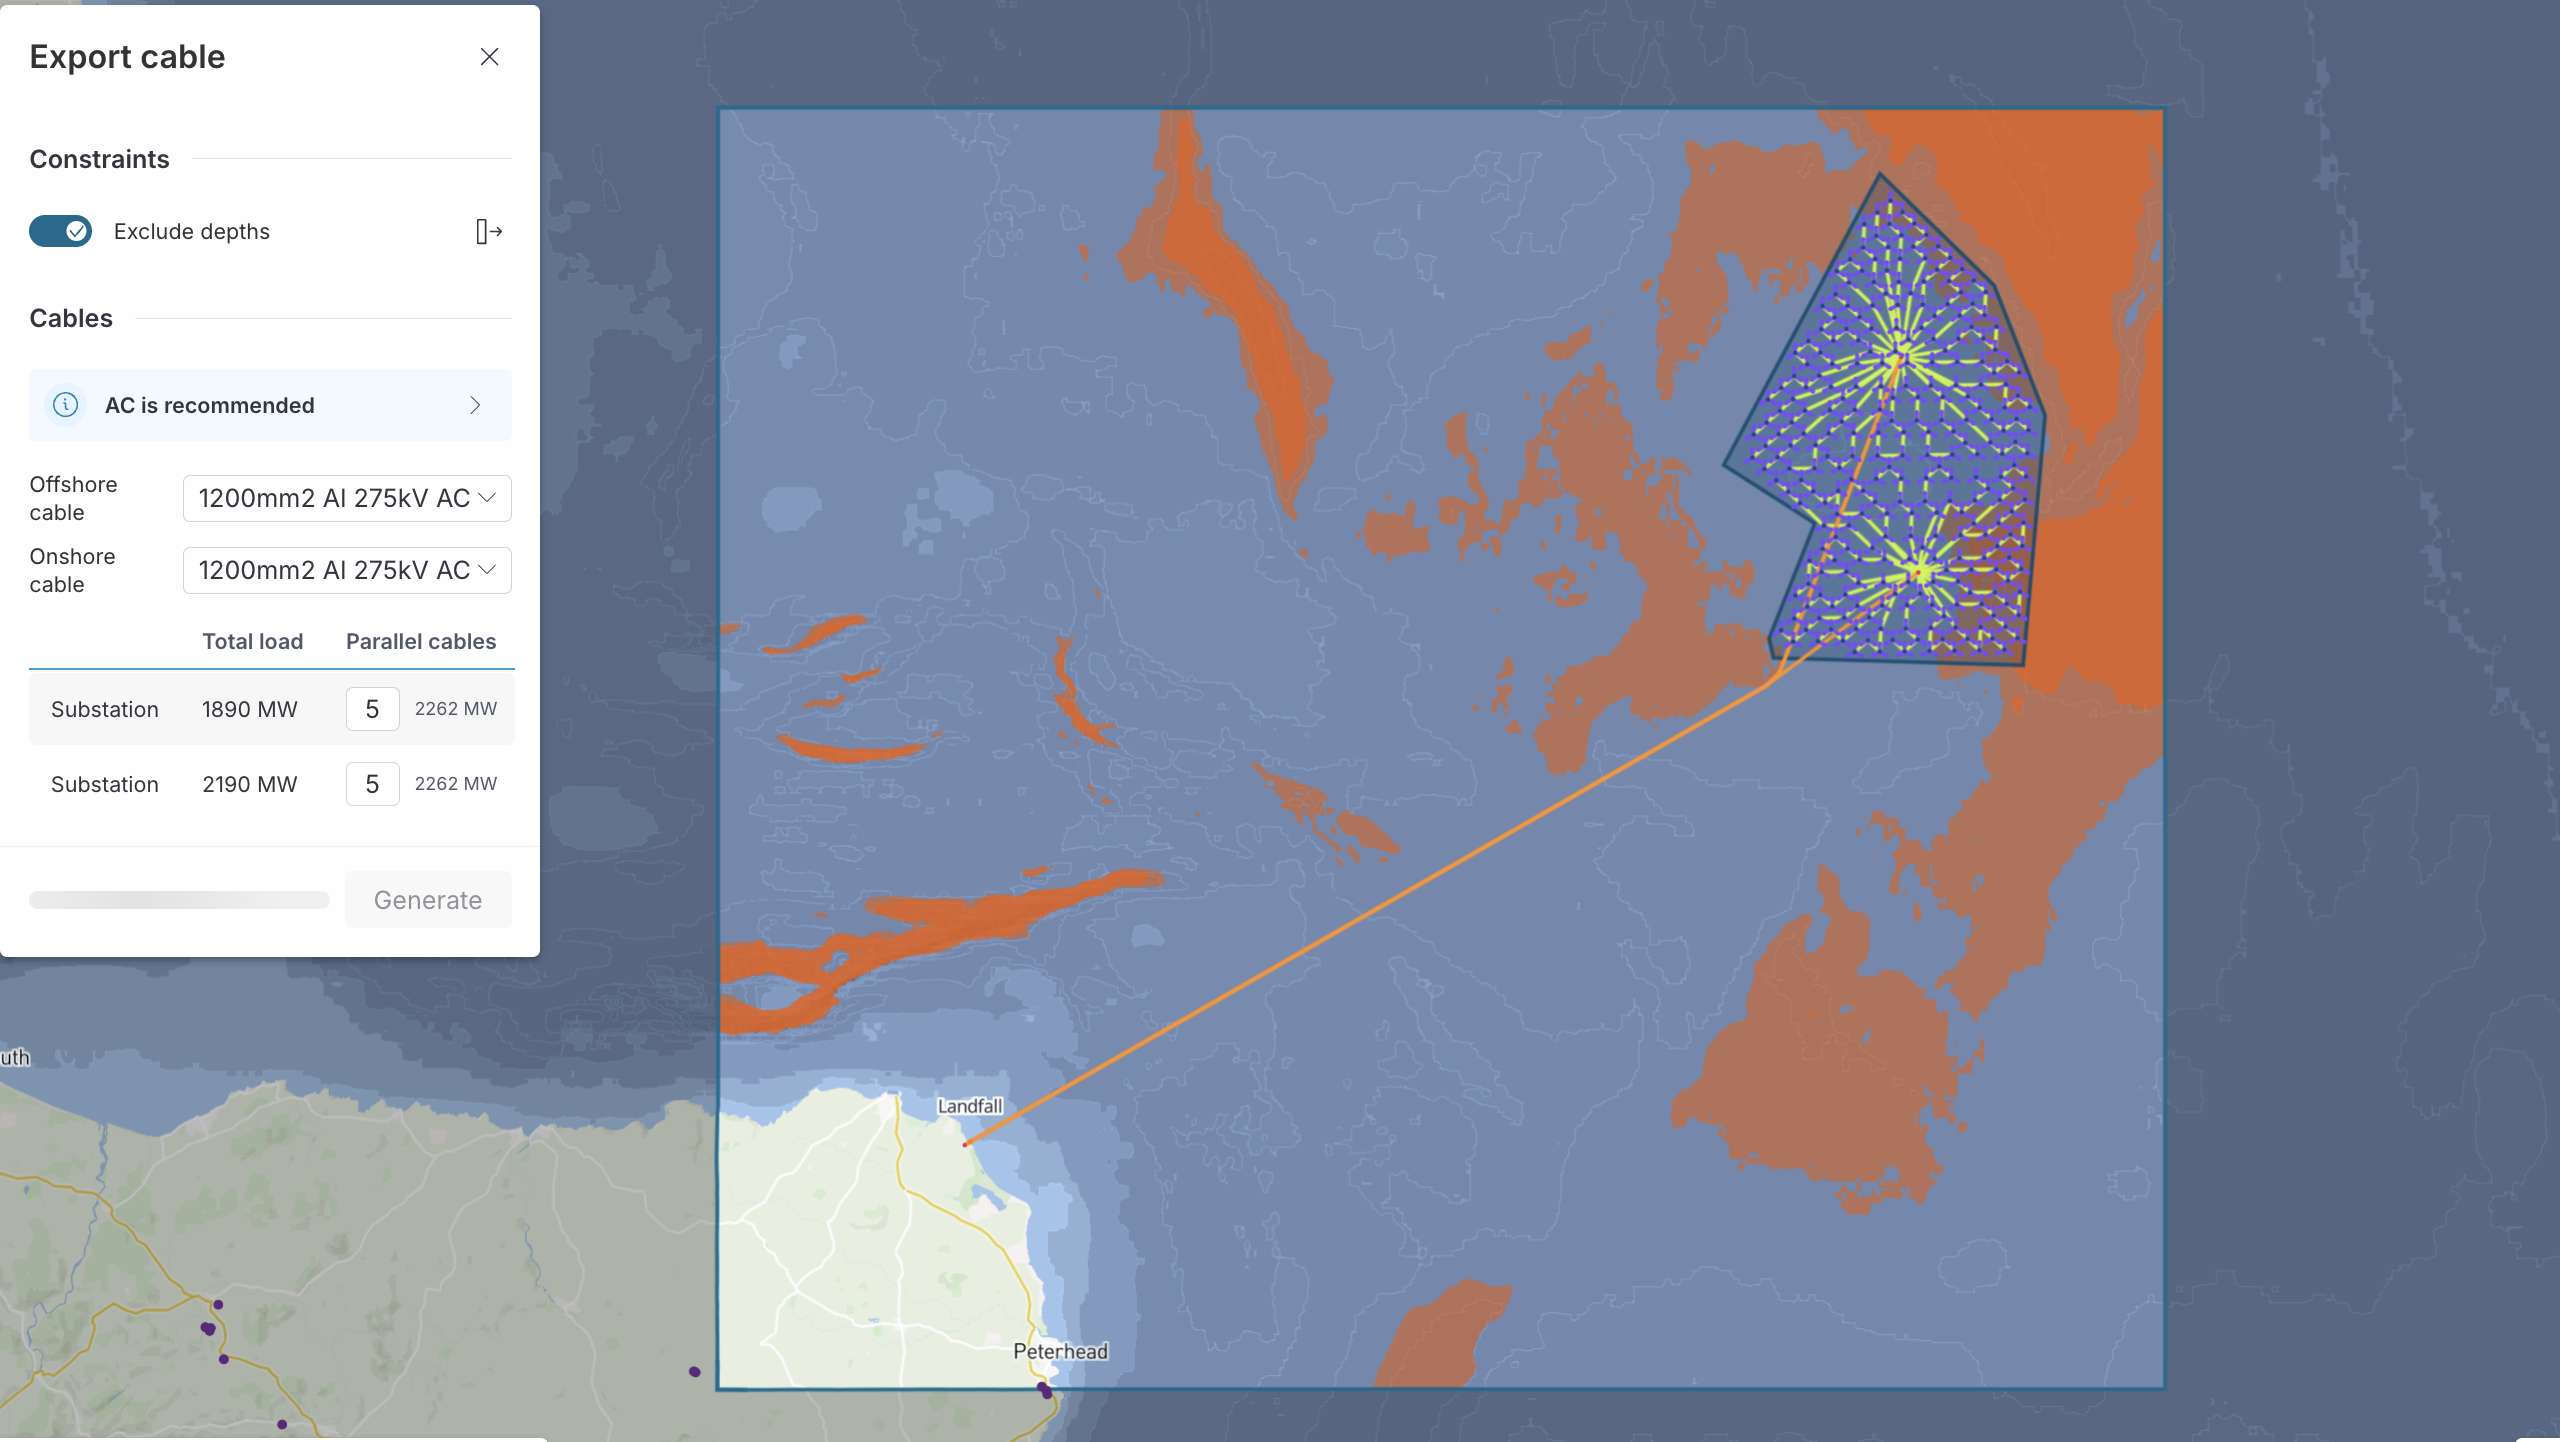
Modelling, analysing and optimising the whole electrical system for your wind farms in Vind AI just got even better. At long last, export cables can now be automatically generated with key constraints built in. Vind AI will:
These constraints are also applied when using a cable corridor, ensuring realistic and cost-aware routing.
On top of this, the landfall point is now editable, giving you greater control over how export cables connect from offshore to onshore substations.
(Want to learn more about co-optimising turbine layout and cables in Vind AI? Scroll down to the “Insight” section below for more on this topic in our latest blog!)
Integrating local impact factors into your onshore park design at an early stage is now easier than ever. We now support hard noise constraints in layout optimisation for onshore projects.
If you have sensors in the park area, simply toggle noise optimisation on and select a regulatory configuration. All optimised layouts will then automatically respect the specified noise limit.
This works across all optimisation methods—making it easier to design compliant layouts without manual adjustments.

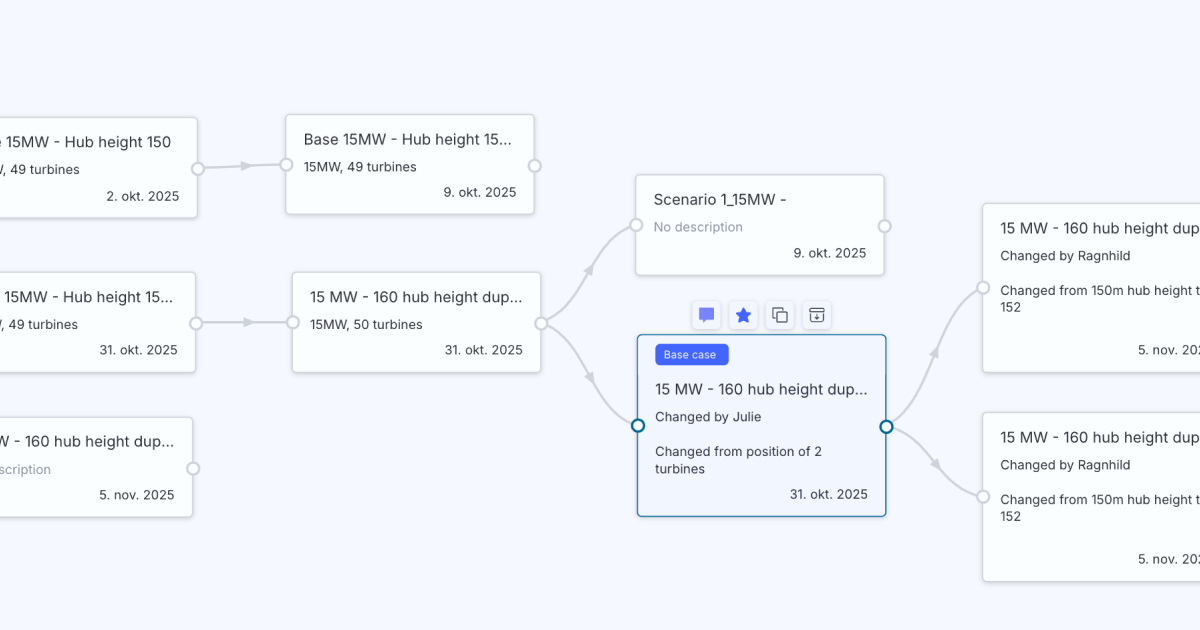
We have added a quick and visual way to spot trends, compare options and share insights with your team.
With the new Graph Visualisation button within the Compare functionality, Vind AI lets you plot results directly in charts.
You can now:

We’ve streamlined the way costs are calculated, so all costs specified per MW are now factored into your financial analysis, whether or not the corresponding components have been modelled in the park.
Previously, a cost category only applied if the related components were explicitly added into the park modelling (for example, inter array cable costs required cables to be in the design). Now, if inter array cables are specified at 10k€/MW, it will be considered automatically.
This change makes it faster to:

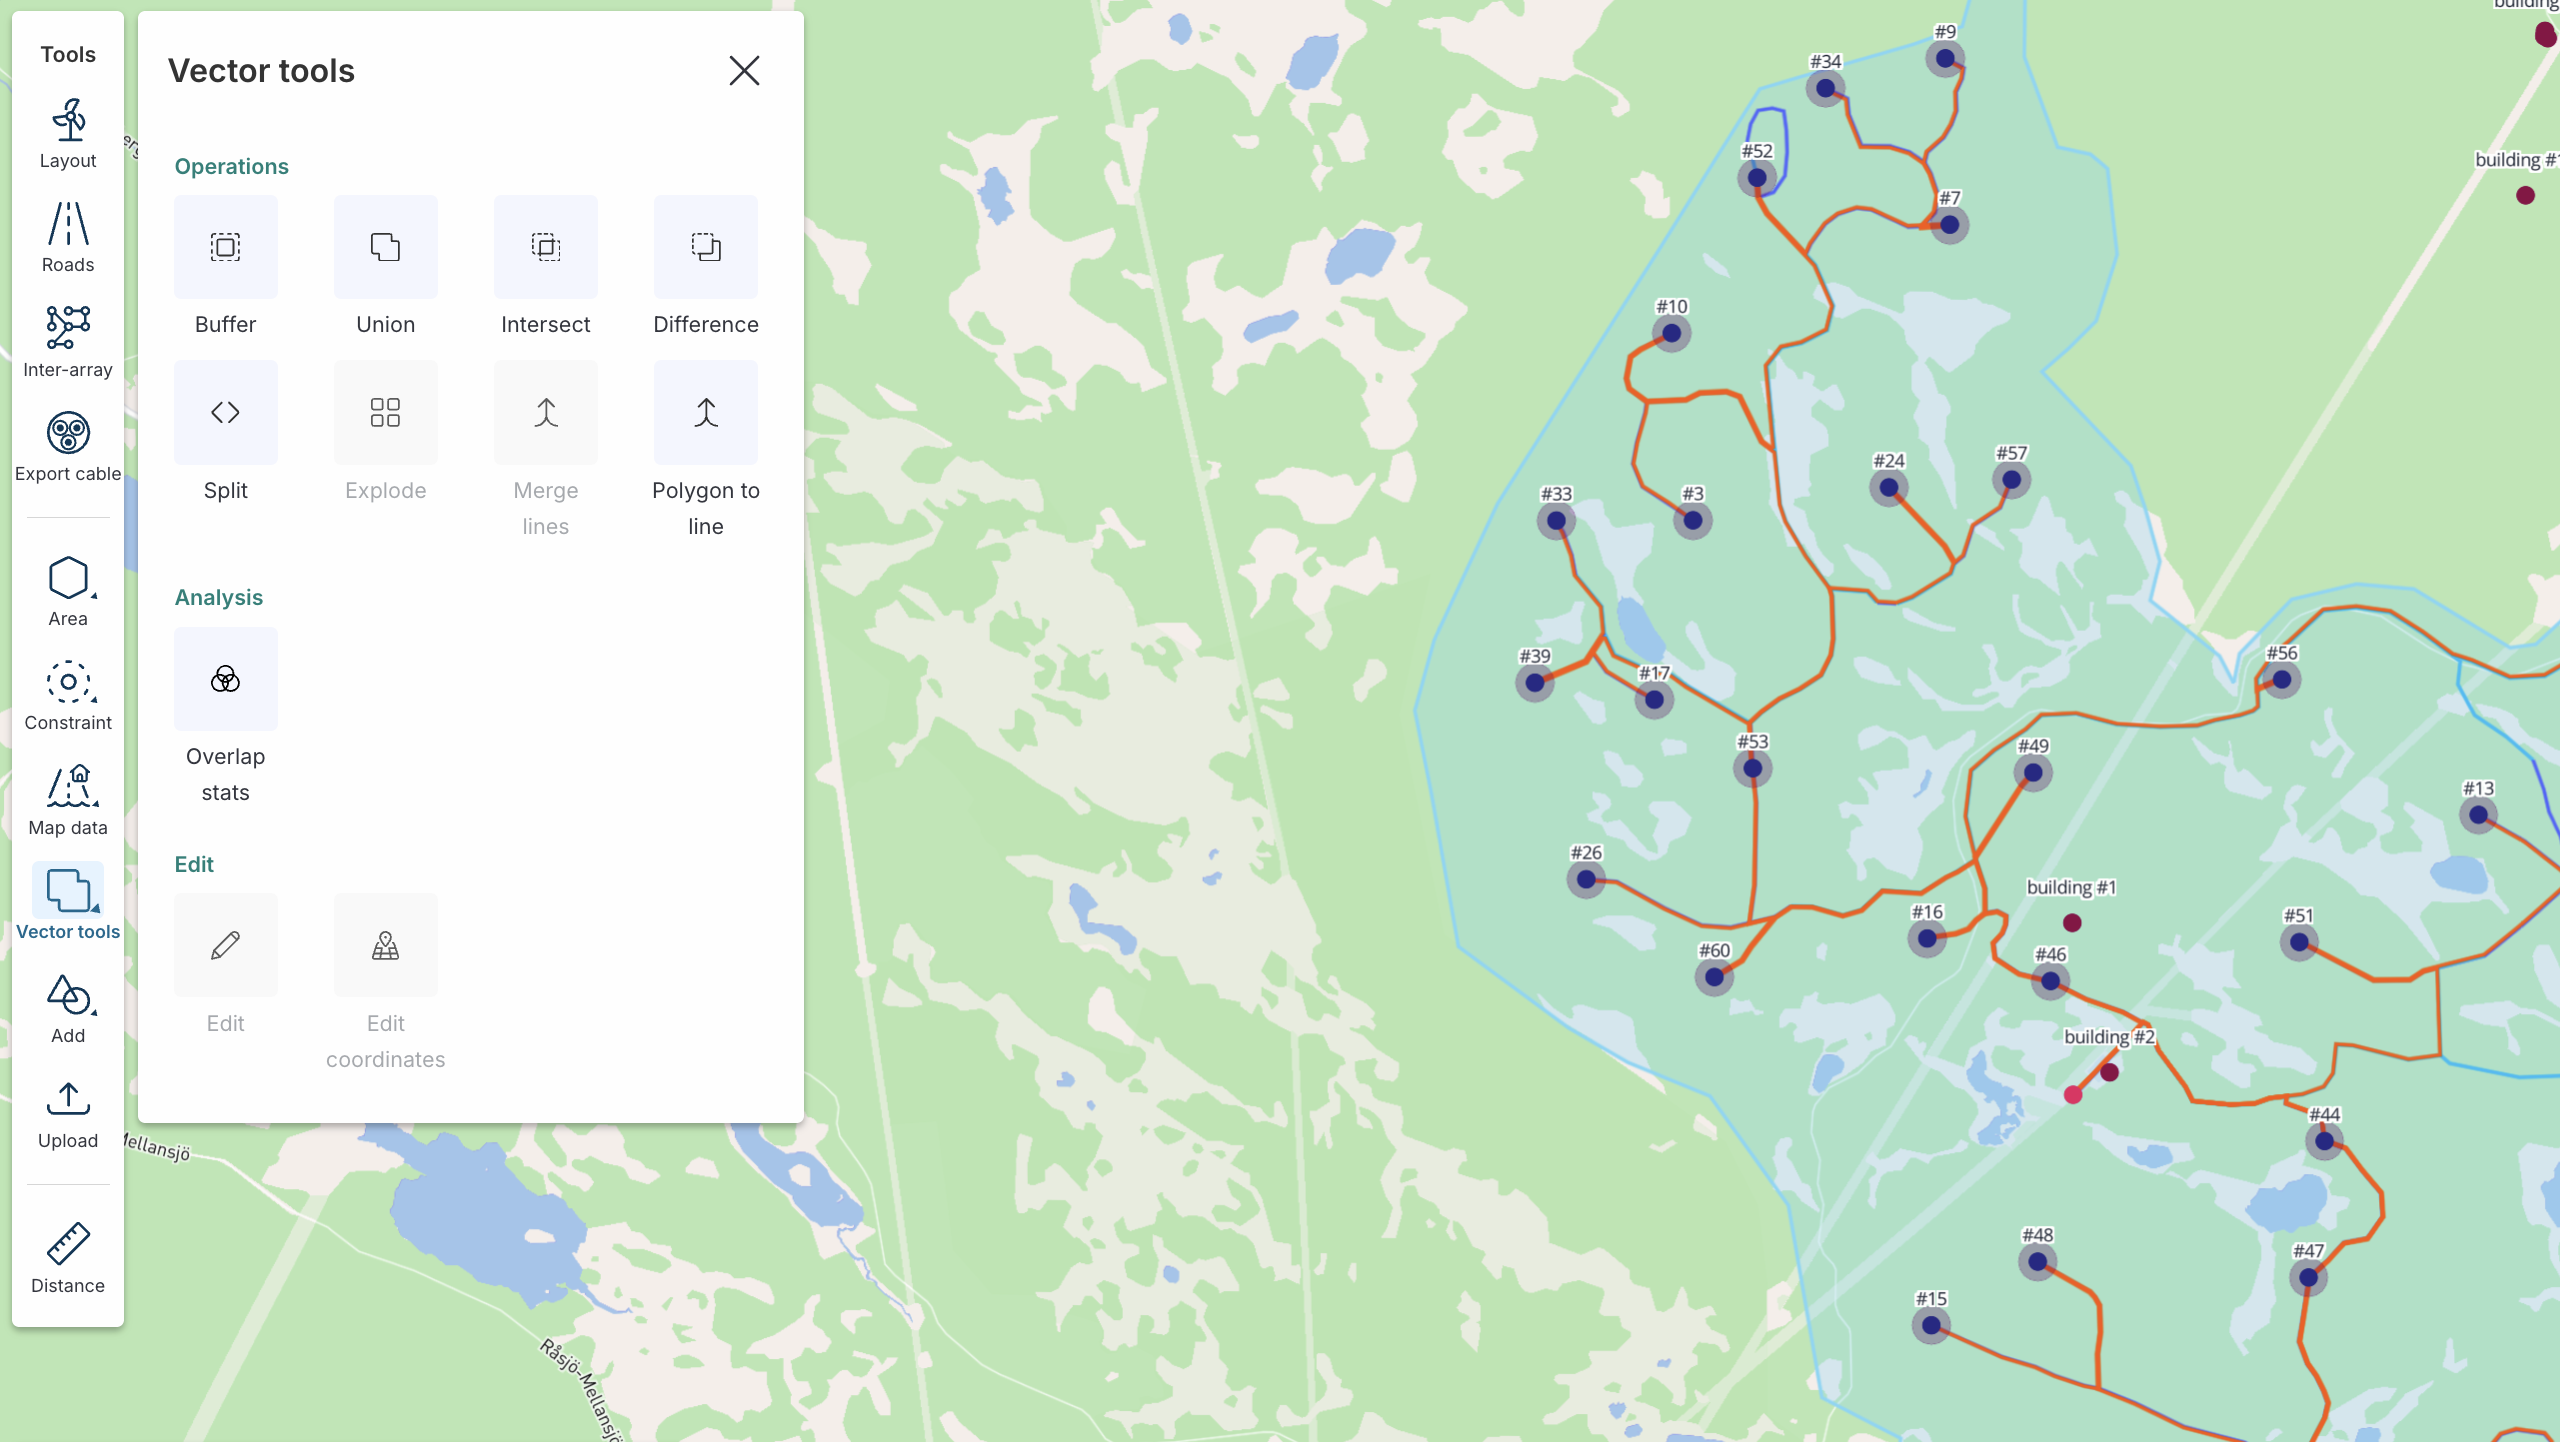
We’ve made it easier to find and use Vind AI’s powerful vector operations.
You can now open a dedicated Vector Tools menu from the left-hand side to see all available operations in one place.
When launching most operations (except Edit, Explode, and Merge Lines), you can choose features directly from the map to operate on.
To get the newest product updates, case stories and news releases, sign up for our monthly newsletter.
Please reach out if you are interested in seeing a demo, asking a question or sharing feedback.


.png)