.png)
Your feedback, questions, and ideas matter to us! What we hear from customers is always taken into consideration when we plan what to build next. This month is a good example: from per-turbine timeseries exports to NPV calculations and site suitability compliance checks, your input shaped a big part of what we've created.
Site suitability analysis
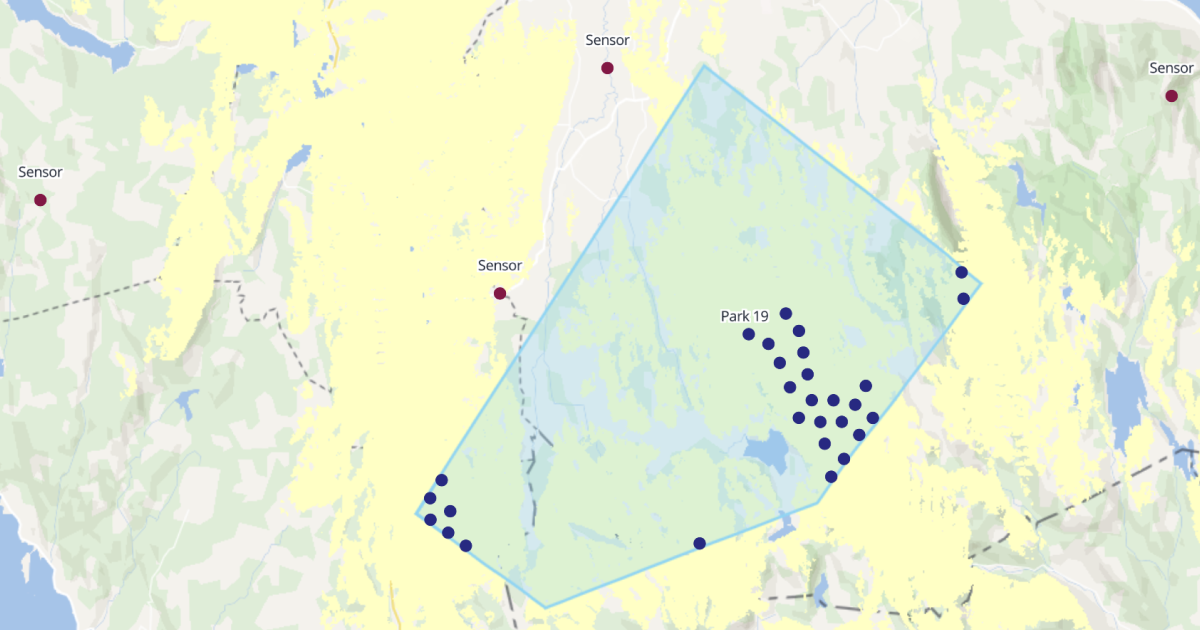
Last month, we gave you a sneak peek, and now it’s here. You can now run a full site suitability analysis directly in Vind AI, assessing turbine positions against all nine IEC 61400-1 requirements using your selected wind configuration and the new suitability tab in your regulatory settings. Where results depend on location, they're shown as rasters so you can see the spatial extent of any issues at a glance, with a dedicated eight-widget dashboard and full methodology documentation in the help centre and trust centre.
And because site suitability is often a governing constraint, we've gone a step further: you can now apply it directly within layout optimisation, onshore and offshore, as a constraint. It's been a highly requested addition, and one that no other software on the market currently offers.

Per-turbine timeseries: Granular power output, on demand
This one has been requested the most this month. You can now download a per-turbine post-wake power time-series CSV directly from the production panel, with one column per named turbine in MW in local time for every timestep in your analysis. For analyses that include blockage effects, you'll receive separate excl. and incl. blockage variants. It's now just a single click away.

Net Present Value: Absolute financial returns, now alongside IRR
Vind AI now calculates Net Present Value (NPV) alongside IRR, with results available across Financial analysis, Dashboard, Compare, and Portfolio. While IRR expresses return as a relative percentage, NPV gives you the absolute figure: the total value a project is expected to generate in today’s money. It's a particularly useful addition where a larger project might outperform a smaller one in absolute terms, even if the IRR is lower. No extra inputs needed; it updates automatically as you adjust costs, revenues, or the discount rate.

Global Wind Atlas v4: A stronger wind data foundation
The platform now supports Global Wind Atlas v4 across spatial calibration, wind background maps, and WAsP generalised wind climate—bringing entirely new microscale modelling, updated elevation, roughness, and stability inputs to your wind assessments.
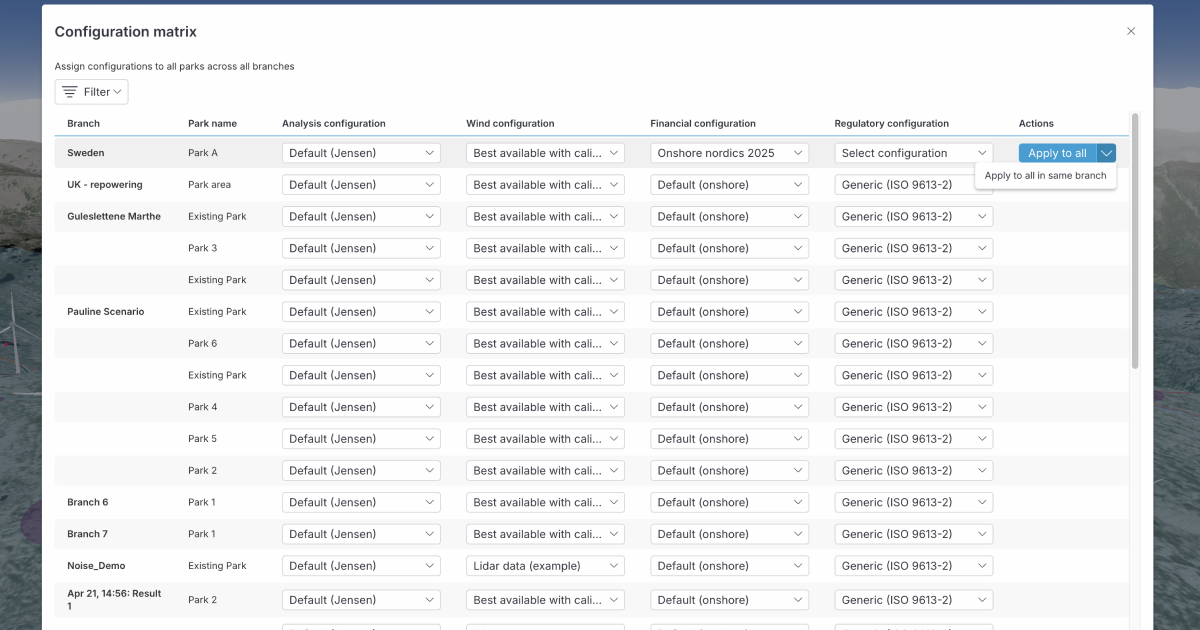
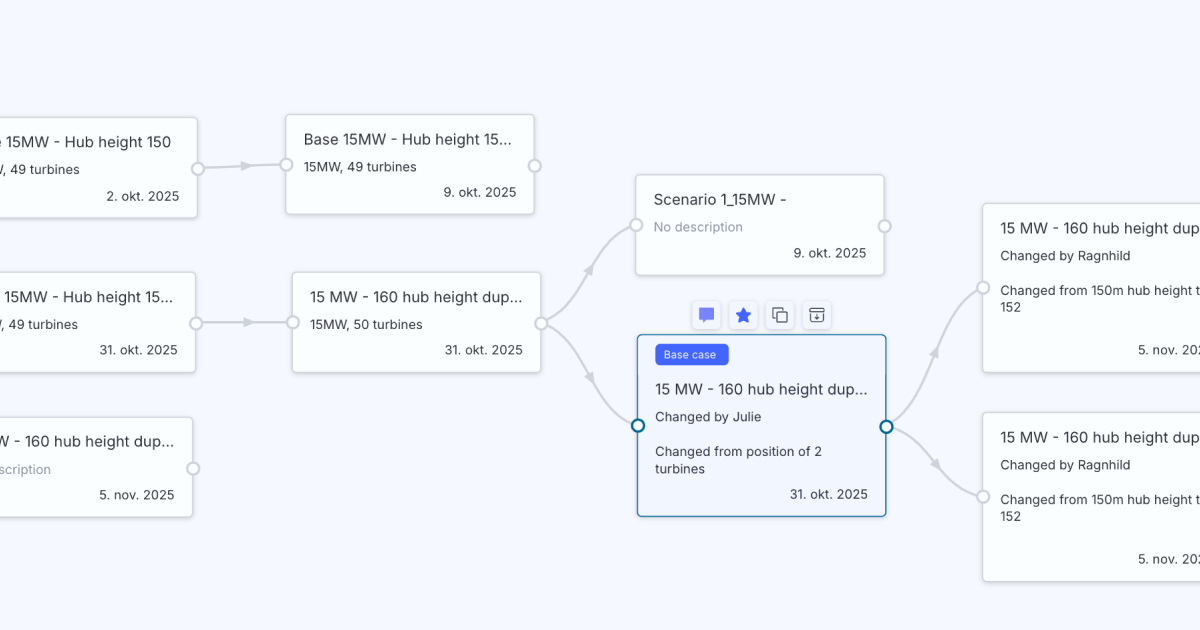
Configuration matrix: One view across all project branches
The configuration matrix now shows parks from every branch in your project, giving you a complete picture of all scenarios in one place. A new action button lets you apply a row's configuration to all parks project-wide, or to all parks within a single branch—cutting the time needed to manage and synchronise multi-scenario studies.
QGIS integration: Paste features directly into Vind
A request we've had from several GIS-heavy teams: you can now copy and paste features directly between Vind AI and QGIS, in both directions, without the detour of exporting and re-importing files. For teams who regularly move between tools, it's one less step you need to take.
To get the newest product updates, case stories and news releases, sign up for our monthly newsletter.
Please reach out if you are interested in seeing a demo, asking a question or sharing feedback.