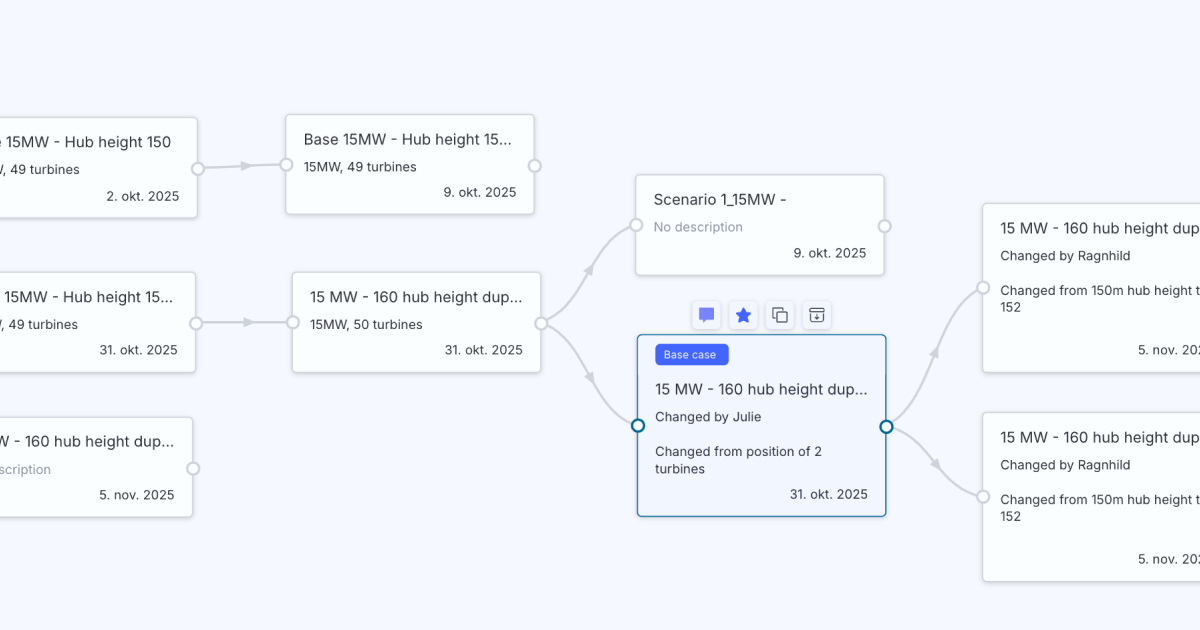
The scenario modelling and comparison feature in Vind AI just got even easier to use. You can now organise your branches in a clear hierarchical structure, showing exactly which scenarios originate from which. Mark your current hypothesis as a base case and visualise relationships directly in the Scenario Manager.
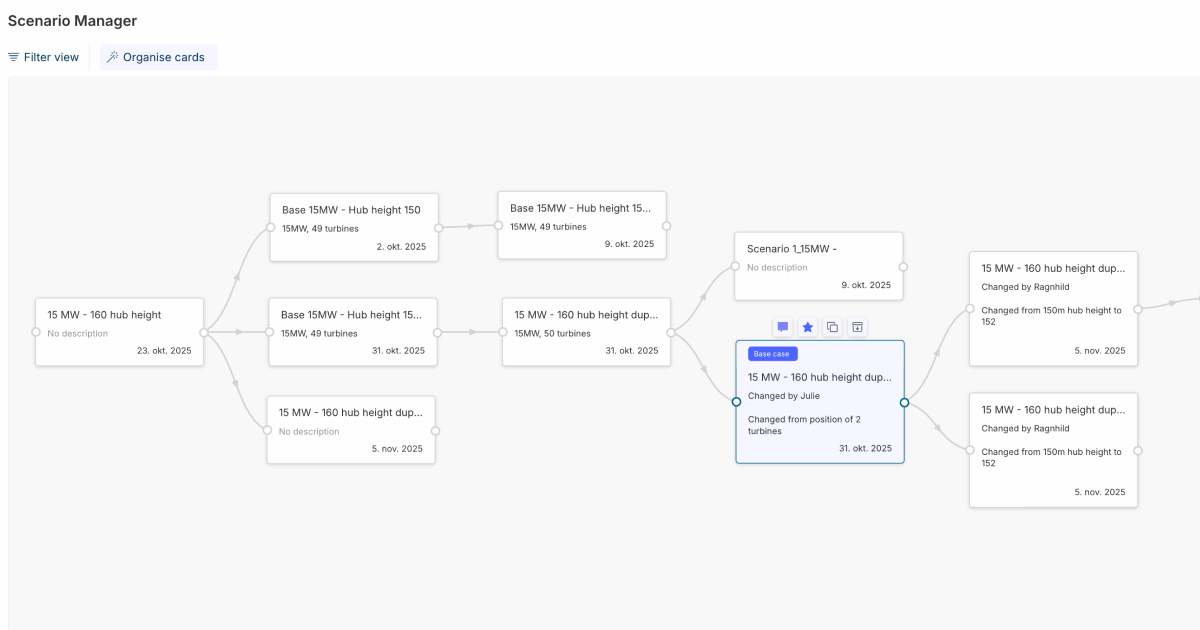
What’s new:
Get a full overview of the scenario modelling feature in Vind AI here.
Shadow flicker analysis is one of the features built into Vind AI for assessing impact on neighbouring areas, and we’ve now significantly improved its accuracy. Turbines are now modelled as solid disks covering the rotor diameter (always facing the sun).
As a result, the analysis now provides day-level statistics for each sensor, showing the worst day of the year, giving you more precise and reliable flicker data for compliance and layout evaluation.
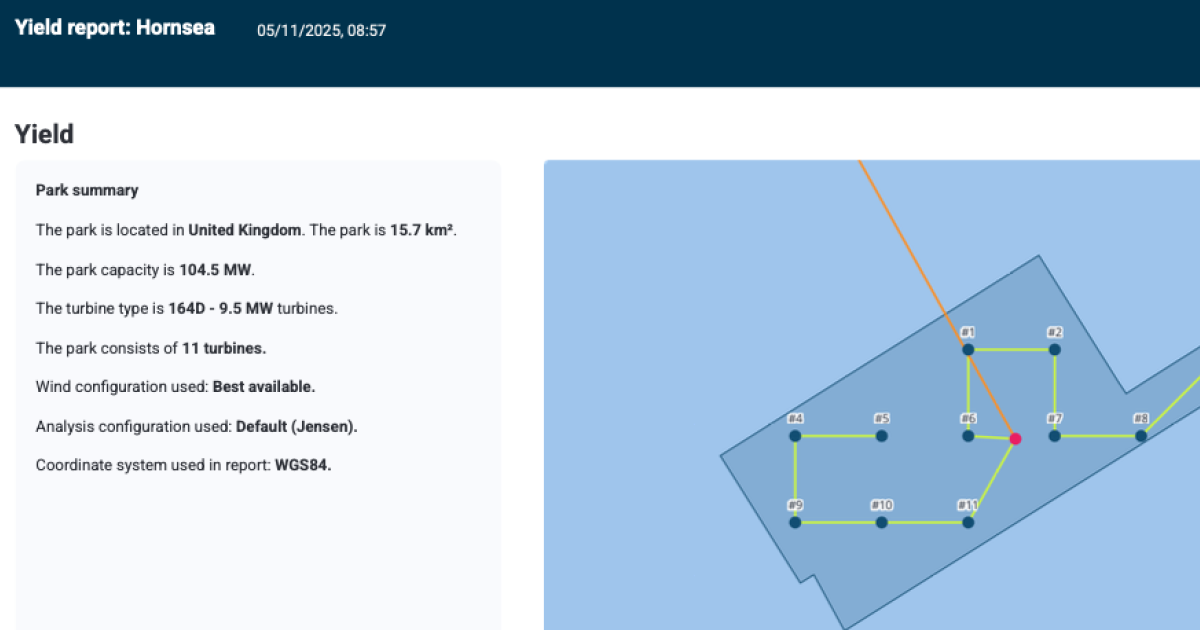
Vind AI’s advanced yield analysis feature lets you perform an accurate assessment of the annual energy production of your wind farm in seconds, with a high degree of customisability. Now, communicating your results is easier than ever: You can download a Yield report directly from Vind AI.
Find the new Download button at the bottom of the Production frame (where you’ll also find the wind data download), or download it straight from the Wind yield dashboard.
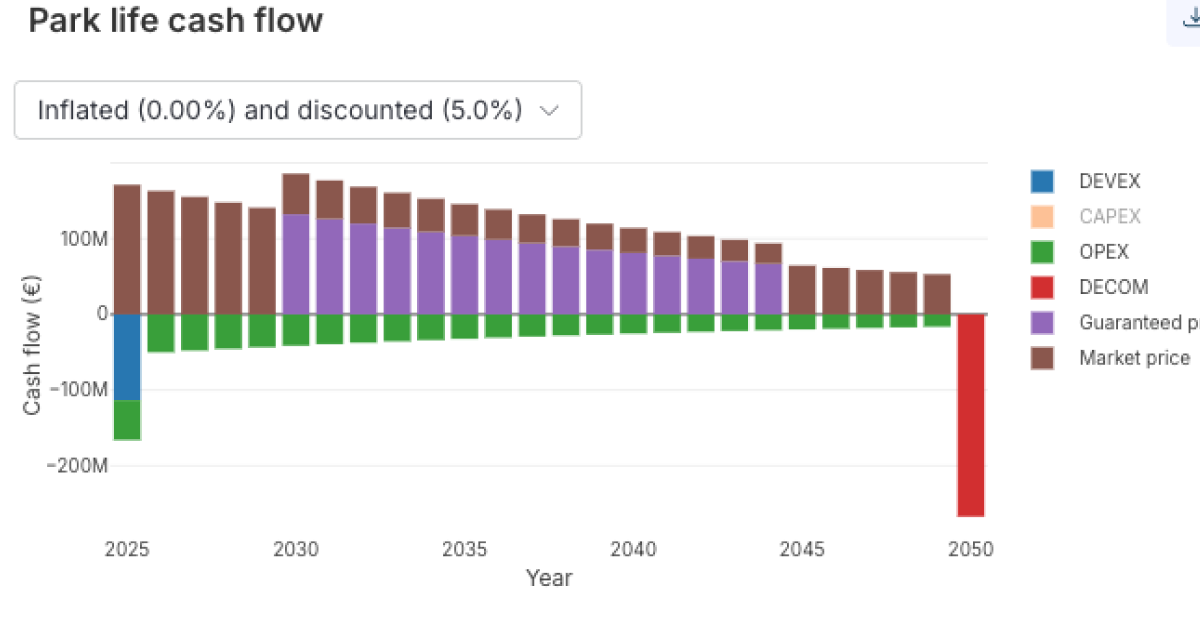
The initial financial performance predictions in Vind AI let you see the whole business case for your wind project faster and earlier. This month, we’ve added new flexibility and transparency to the financial configurations you can make in the platform:
To get the newest product updates, case stories and news releases, sign up for our monthly newsletter.
Please reach out if you are interested in seeing a demo, asking a question or sharing feedback.


.png)