.png)

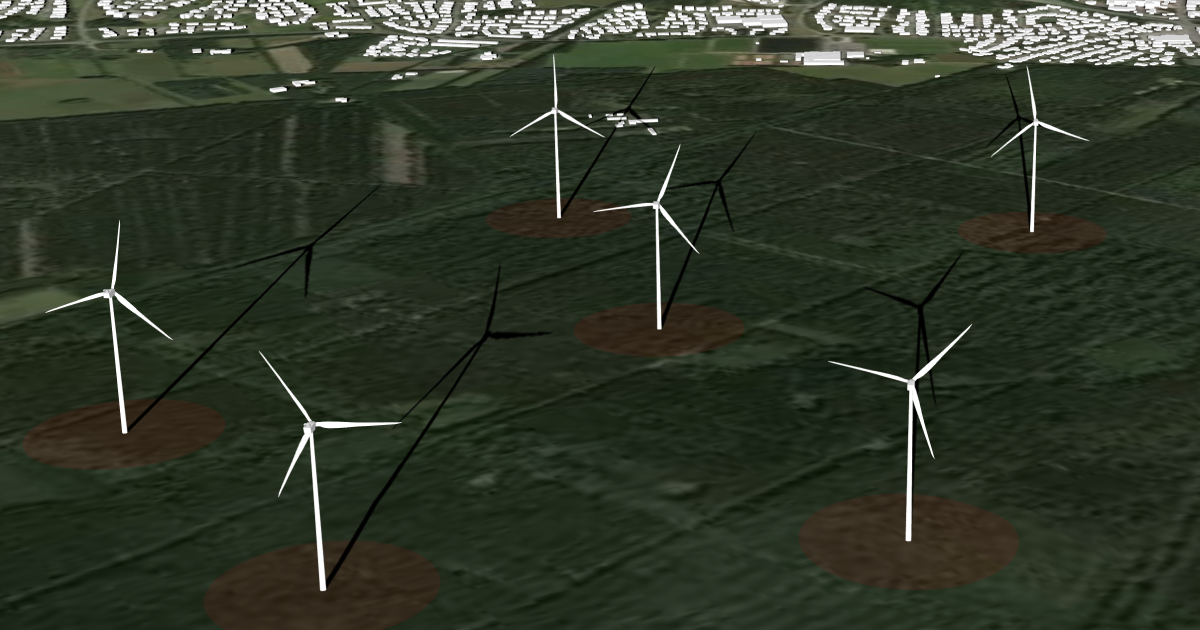
A wind project's technical work, yield calculations, layout iterations, and financial models rarely speak for themselves. The people who need to sign off on it— landowners, local communities, management, investors—need to see it, not just read about it.
This session is for anyone who has to turn dense technical analysis into something a room full of very different people can follow. We'll walk through real-world use cases for visualising renewable projects and demo the visual tools built into Vind AI: 3D park views and photo montages that make local impact tangible, shadow and viewshed analysis for community consultations, and financial dashboards that turn numbers into a visual story.
Note: If you’re unable to attend the webinar live, we encourage you to register anyway, you’ll receive access to watch it on demand at your convenience