.png)
We are going to back to the basics: how the wind farm design process works. In essence, it is the process of turning a windy piece of land or seabed into a permitted, financeable, optimised power plant — and in 2026 it runs across eight stages, from site screening to financial reporting. This guide follows each stage in the order a project actually moves through them, names the tools and decisions at each one, and flags the six mistakes that most often blow up a budget. The information gain you won't find in the first ten search results: a real, anonymised project timeline showing how many weeks each stage takes, and how that compresses when the work is done on a single modelling platform instead of stitched together across different tools.
Designing a wind farm means working through eight stages in sequence — site selection, constraints mapping, wind resource assessment, preliminary layout, layout optimisation, impact assessment, financial check, and reporting. Each stage feeds the next: bad wind data corrupts the layout, a missed constraint forces a redesign, and a layout that ignores wake losses overstates the energy yield. The whole cycle can take as little as a couple months and produces a layout that maximises annual energy production within every physical, environmental, and regulatory limit on the site.
Wind farm design is the engineering and planning work that decides where each turbine stands, how many there are, and what they connect to — so the site produces the most energy possible within every constraint that applies to it. It is not a single calculation. It is a sequence of dependent decisions where each output becomes the next input.
The process runs in eight stages:
The order matters because the dependencies run one way. You cannot optimise a layout before you have wind data; you cannot trust a financial model built on an unmeasured resource; and a constraint discovered in stage six an force you back to stage four. Let's walk through each stage together.
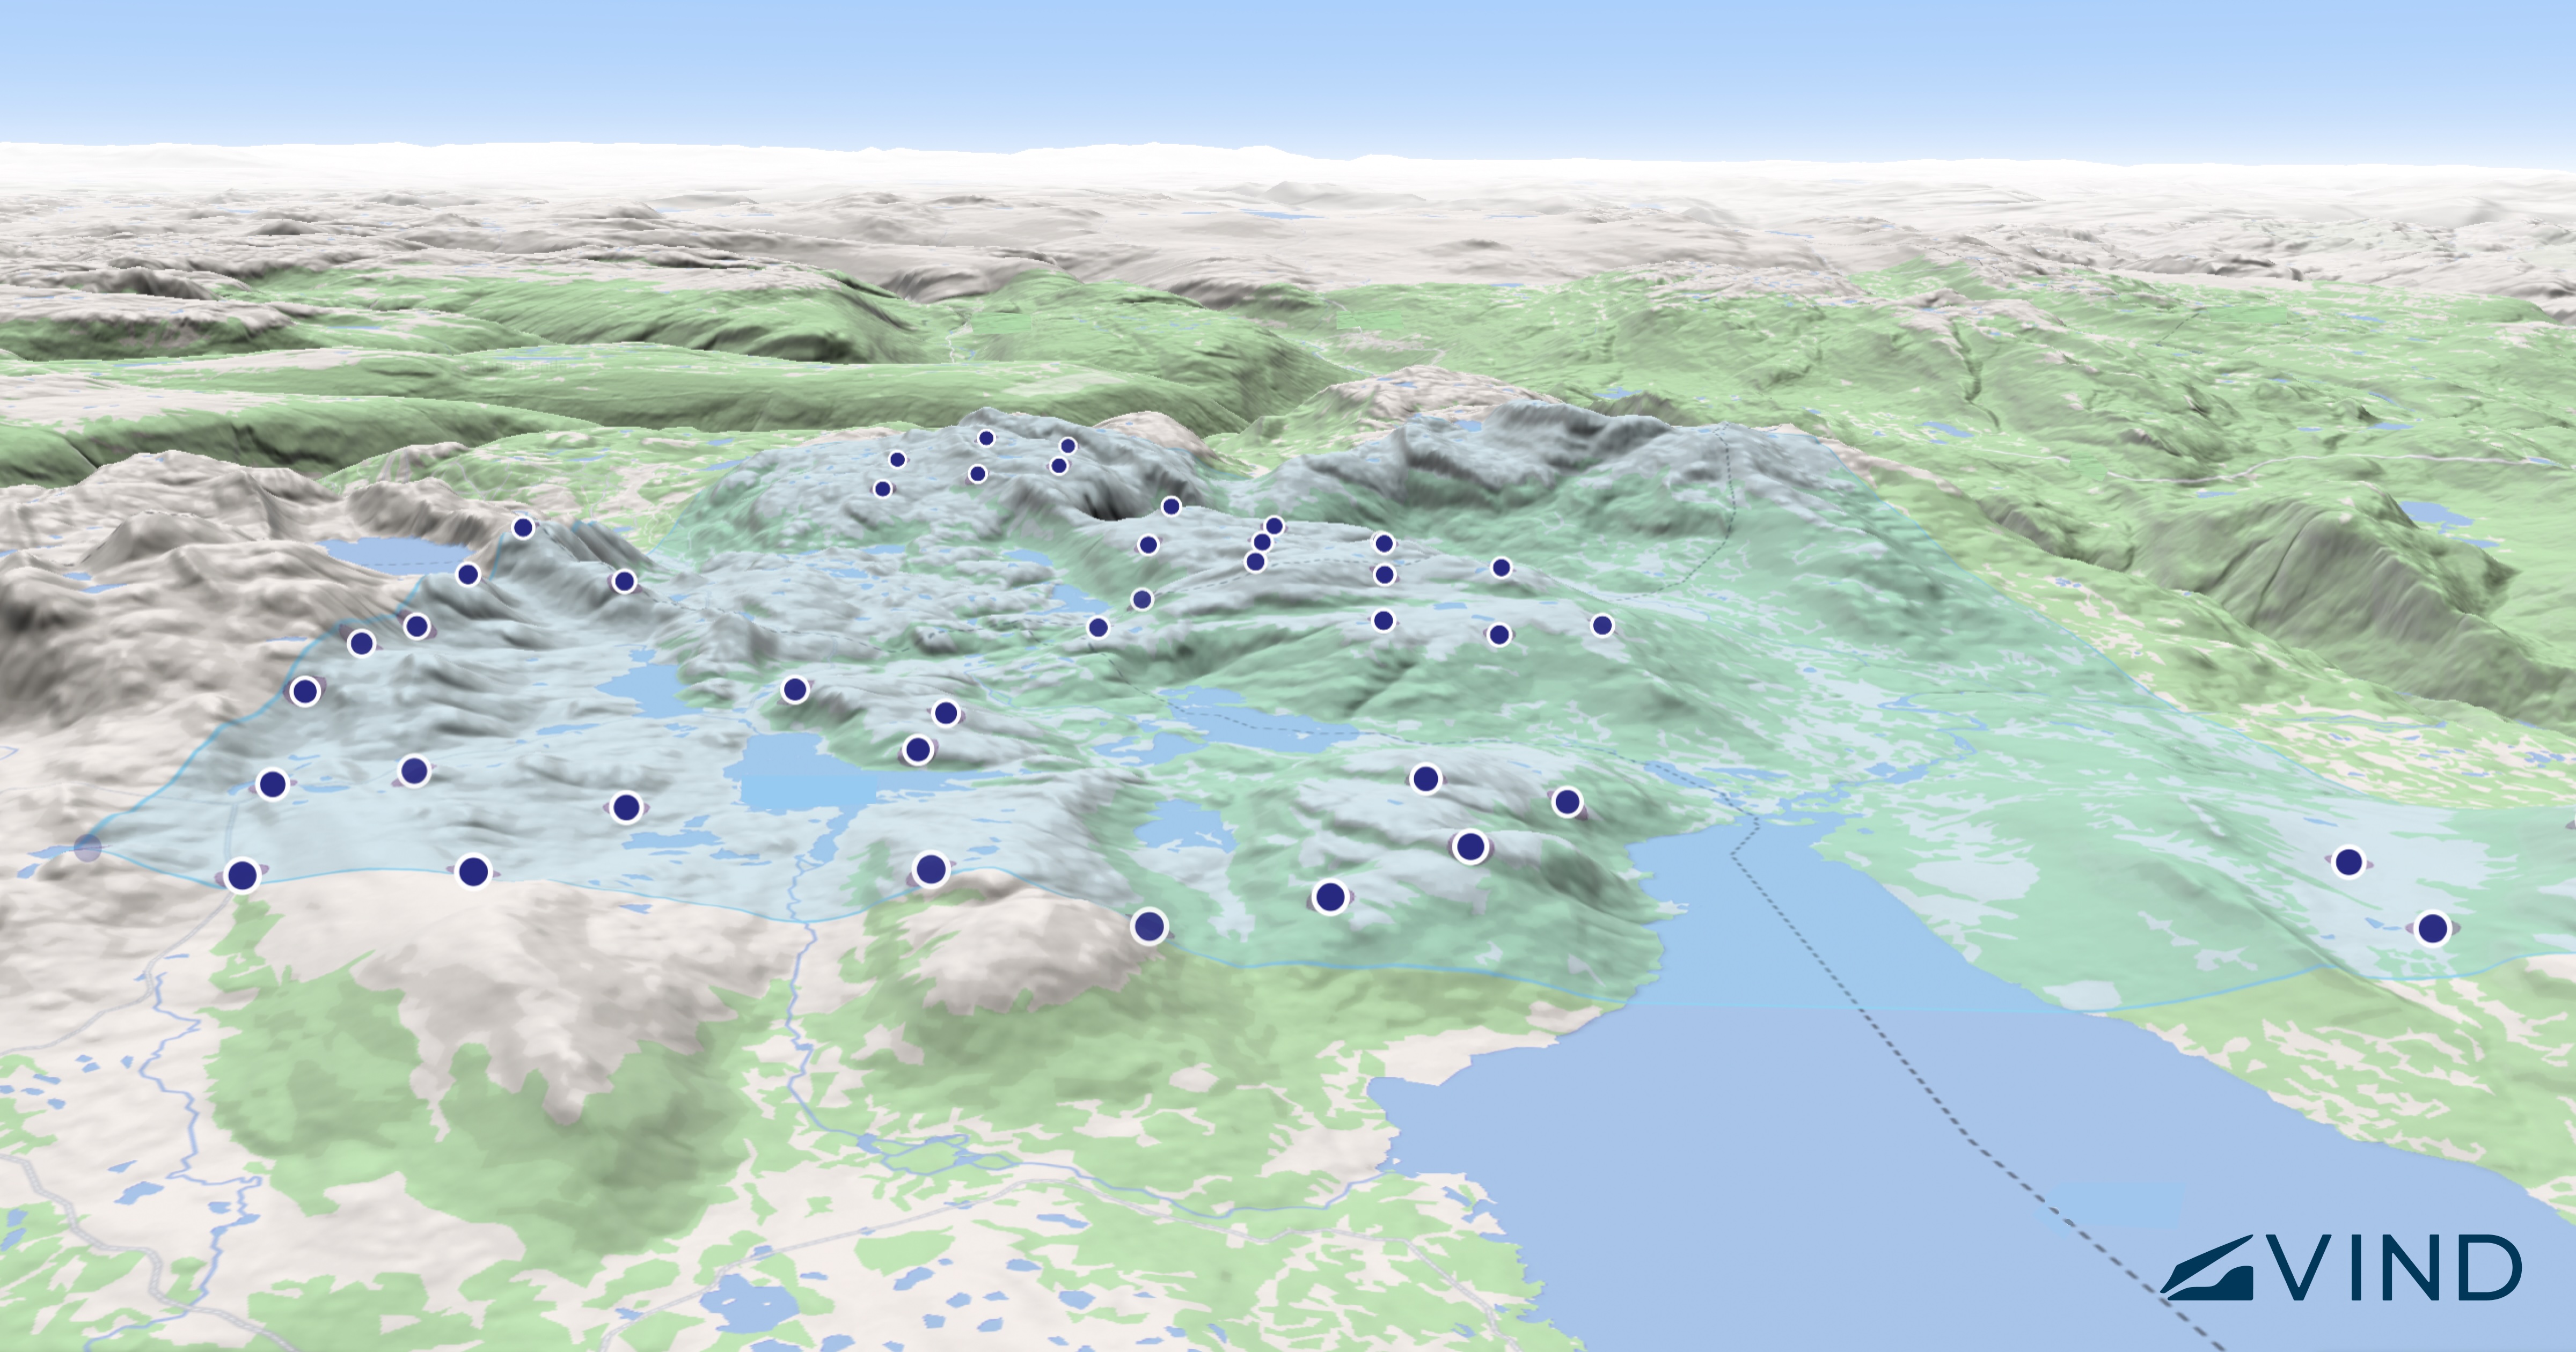
Site selection is the single highest-leverage decision in wind farm design: a strong wind resource with few constraints will out-earn a clever layout on a mediocre site every time. The goal of this stage is to move from a wide region of interest down to one or two sites worth committing measurement budget to.
Three factors are taken into account during this stage. The first is the wind itself — long-term average wind speed, prevailing direction, and how steady or gusty the regime is. The second is grid access — the distance to a connection point with available capacity, because cabling and substation costs scale with that distance and grid queues can delay a project by years. The third is buildability and access — terrain that construction vehicles and crane convoys can actually reach.
Screening is done desk-first, before anyone visits. You overlay public wind atlases, terrain models, grid maps, and land-ownership data in a GIS environment and eliminate anything that fails a hard criterion. A site with mean wind below roughly 6 m/s at hub height, or 40 km from the nearest viable grid node, usually drops out before you spend a cent on fieldwork.
A structured screening workflow on a wind farm design platform lets you rank dozens of candidate sites on these criteria in days rather than weeks, then commit measurement spend only to the survivors.

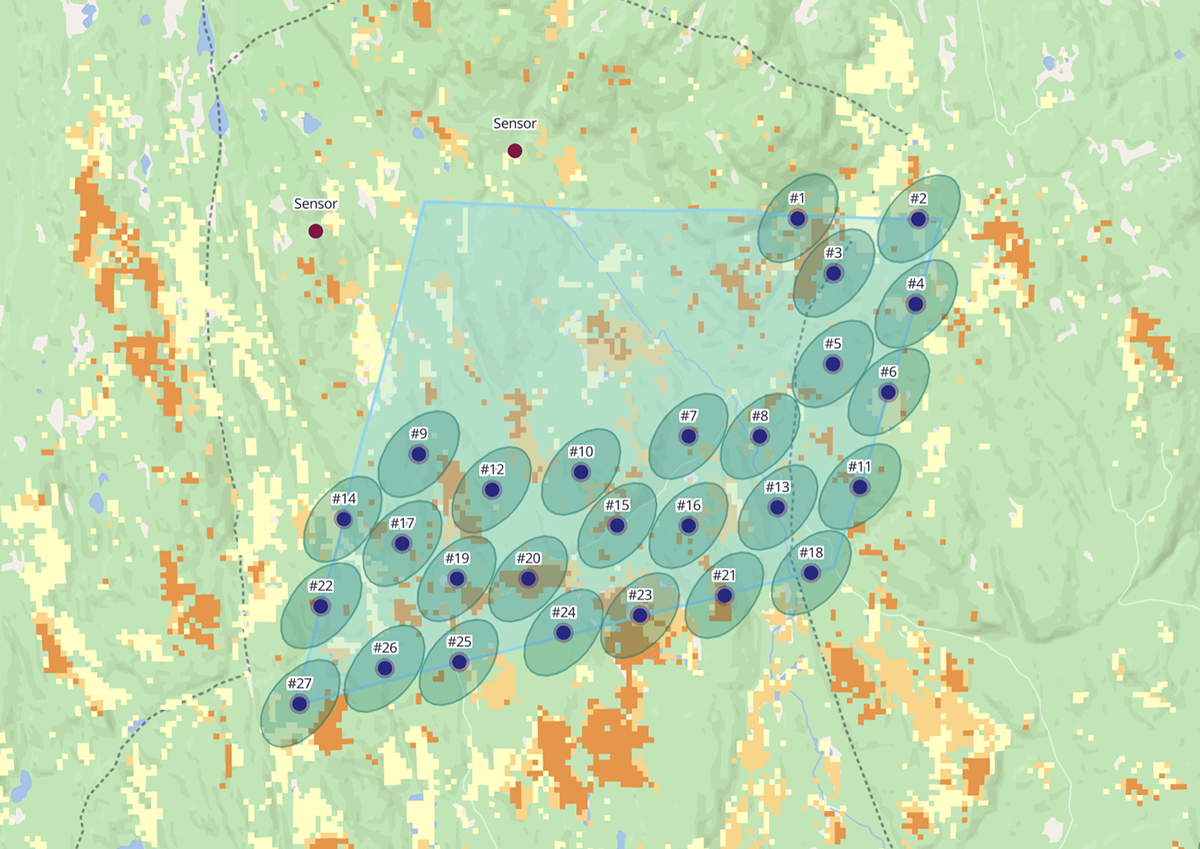
Constraints mapping is the exercise of drawing every limit on a site — physical, environmental, and regulatory — onto one map so the layout never proposes a turbine where one cannot legally or physically stand. Skipping or rushing this stage is the most common cause of late, expensive redesigns.
Constraints come in three types. Physical constraints on the ground itself: steep slopes, watercourses, existing buildings, roads, and underground services. Regulatory constraints are the rules: residential setback distances, aviation and radar safeguarding zones, noise limits, and planning-designated exclusion areas. Environmental constraints are the protected features: designated habitats, bird and bat flight corridors, and landscape-protection zones.
The output of this stage is a "developable area" polygon — the land left over once every exclusion zone is subtracted. Modern practice builds this in GIS from layered datasets, increasingly enriched with LiDAR-derived terrain and high-resolution satellite imagery so that slope and feature exclusions are exact rather than estimated.
The discipline here is completeness. A setback you forget at this stage does not disappear — it reappears in stage six as a refused permit. Tight integration between your constraints and GIS data layers and the layout tool means an updated constraint instantly reshapes the developable area the optimiser is allowed to use, instead of being checked manually after the fact.
Wind resource assessment measures and models the wind across the site so you can predict, with quantified uncertainty, how much energy the finished wind farm will generate. Every downstream number — layout, energy yield, revenue — inherits the accuracy of this stage, which is why it carries the most measurement time of any single stage.
The classic instrument is the met mast: a tall tower carrying anemometers and wind vanes at several heights, recording wind speed and direction continuously for ideally a year or more. Increasingly, remote-sensing devices — ground-based LiDAR and SODAR — supplement or replace masts because they profile wind across the full rotor span without a tall structure.
Raw measurements become a usable resource picture through several steps. The data is cleaned and gap-filled, then correlated against a long-term reference (a nearby station or reanalysis dataset) to extrapolate the short measurement campaign to a representative long-term average — a procedure known as Measure-Correlate-Predict. The result is summarised as a wind rose showing the frequency of each speed and direction, plus statistics on turbulence and extreme winds that drive turbine-class selection.
That long-term wind distribution, combined with terrain-aware flow modelling across the whole site, is what every later stage relies on. Underestimate the resource and you under-build; overestimate it and the financial model promises energy that never arrives.

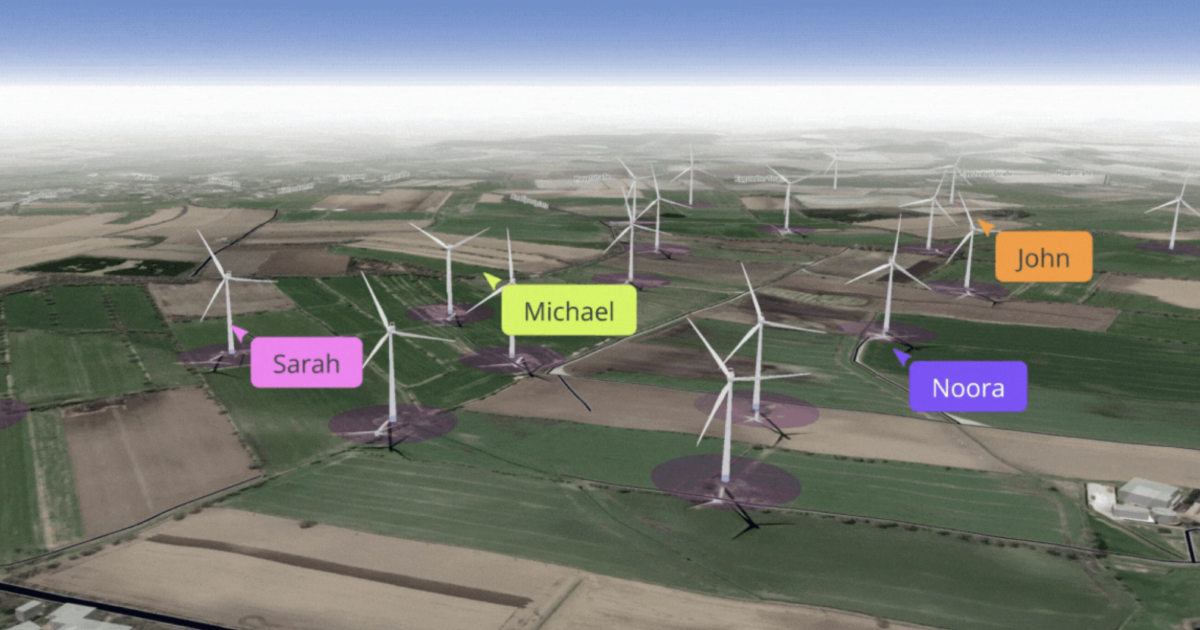
The preliminary layout is the first concrete arrangement of turbines on the developable area — a sensible starting point that respects spacing rules and prevailing wind, before formal optimisation refines it. It is a hypothesis, not the answer.
A good first layout is shaped by three things: the prevailing wind direction (rows are typically spread out along it to limit one turbine stealing wind from the next), the developable-area polygon from constraints mapping, and rule-of-thumb spacing — commonly something like five to nine rotor diameters between turbines, wider in the dominant wind direction. Terrain, access-road routing, and cable runs also pull on where turbines can sensibly sit.
The point of doing a preliminary layout by hand or with simple rules first is to sanity-check capacity. It tells you roughly how many turbines the site holds and therefore the order of magnitude of the project, which feeds an early financial gut-check before you invest in full optimisation.
Layout optimisation uses algorithms to search thousands of possible turbine arrangements and find the one that maximises annual energy production while minimising wake losses, cost, and constraint violations. This is where the difference between a competent design and an excellent one is made — and where the gap shows up directly in lifetime revenue.
The core problem is the wake effect: every turbine leaves a slower, more turbulent wind shadow behind it, so a turbine downstream of another produces less and wears faster. Optimisation balances packing in enough turbines to use the site against spreading them out enough to keep wake losses down. The objective is rarely raw energy alone — it is usually the lowest levelised cost of energy (LCoE), which folds in cabling, foundations, and access roads alongside yield.
Running this as an integrated step — where the wake model, the cost model, and the constraint map all live in one engine — is what layout optimisation tooling is built for. The alternative, exporting layouts between separate wake, cost, and GIS tools, is slow and error-prone, and it is where many subtle constraint breaches creep in.
Impact assessment quantifies the wind farm's effects on wildlife, noise, landscape, and local communities, and defines the mitigation needed to make the project permittable. It is both a legal requirement and a design input, because its findings can send you back to the layout.
The technical strands include noise modelling (predicting sound levels at the nearest dwellings against legal limits), shadow-flicker analysis, visual and landscape assessment, and ecological surveys covering protected birds, bats, and habitats. Each can constrain the layout: a noise breach at one house may force a turbine to move or run in a reduced-power mode at night.
Two things run alongside the technical work. The first is regulatory compliance — assembling the evidence and documentation that local and national authorities require to grant consent. The second is stakeholder engagement: early, honest dialogue with residents, landowners, and local authorities. Projects that engage late or defensively meet organised opposition; projects that engage early can often design out the objections before they harden. A structured local impact assessment workflow keeps noise, shadow, and visual analyses tied to the live layout, so a turbine move automatically re-runs the checks rather than invalidating last month's report.
The financial check models capital cost, operating cost, energy yield, and revenue across the project's life to confirm it earns an acceptable return — and to compare design options on a common money basis. This is the stage where engineering decisions become an investment case.
On the cost side you tally capital expenditure (turbines, foundations, cabling, substation, access roads, grid connection) and operating expenditure (maintenance, land lease, insurance, balancing). On the revenue side you combine the energy yield from the optimised layout with an electricity-price assumption — a power-purchase agreement price, a subsidy or contract-for-difference strike price, or a merchant-market forecast. The headline output is usually LCoE alongside an internal rate of return and net present value.
The financial check is not a one-time gate at the end. The best practice is to run it continuously: every meaningful layout change has a cost and a yield consequence, and seeing both in the same model lets you choose the option that maximises return, not just the one that maximises energy.
Reporting packages the entire design — assumptions, methods, results, and uncertainties — into documents that permitting authorities, lenders, and the construction team can act on. Clear, traceable reporting is what turns months of analysis into approvals and funding.
Different audiences need different cuts of the same work. Regulators need the environmental and planning evidence. Lenders and equity investors need the energy yield assessment and financial model, ideally from an independent perspective, with uncertainty bands stated honestly. The build team needs precise turbine coordinates, foundation specifications, and cable routing. A practical hallmark of mature reporting is full traceability: any number in the final report can be traced back to the input data and method that produced it.
This is also where the perennially searched-for "wind farm design pdf" really lives — not as a generic template, but as the project-specific yield, layout, and financial reports a real development generates. When the underlying analysis sits on one platform, exporting consistent, version-controlled reports is a step rather than a project in itself.
EnBW, one of Europe's largest energy companies, makes the payoff of a disciplined, integrated design process visible at scale. Across its early-phase offshore wind projects, EnBW moved from assessing projects manually, one at a time, to running site assessments and business-case evaluations for every early-phase project on a single platform — a shift its team frames bluntly: "Assessing projects manually project-by-project is the old world. This is the new way of working,"says Adam Verhoeven-Mrosek, Project Analyst Offshore at EnBW.
The transferable lessons map directly onto the eight stages above:
The lesson for any developer, at any scale: the design stages most worth integrating are the analysis-heavy ones around the measurement campaign, because that is where comparability, speed, and better decisions compound. (Read the full story in the EnBW case study.)
Practitioners are defined less by the ideal process they describe than by the failure modes they have learned to avoid. These are the six that most often damage a project.
Wind farm design is the process of planning where and how to build a wind power plant so it generates the most energy possible within every physical, environmental, and regulatory limit on the site. It runs across eight stages, from site selection through wind resource assessment and layout optimisation to financial reporting.
The analysis-heavy stages take a few months combined, but the schedule is usually dominated by the wind measurement campaign, which ideally runs for a full year, and by the consenting process, which varies widely by jurisdiction. End to end, from site screening to a consented, financeable design, projects commonly span one to several years.
As a rough screening rule, the long-term mean wind speed at hub height usually needs to be above about 6 metres per second for an onshore project to be economically viable. The exact threshold depends on turbine technology, electricity price, and project costs, so it is confirmed by the financial check rather than the rule of thumb.
Offshore design adds specialised foundation engineering, marine installation logistics, harsher metocean conditions, and longer, more expensive grid-connection routes. Onshore design contends more with land access, terrain, road logistics, and proximity to residents. The eight-stage process is the same; the constraints, costs, and risk profile differ substantially.
A met mast is a tall tower carrying anemometers and wind vanes at several heights that records wind speed and direction continuously over months or years. It produces the site-specific measured data that underpins the entire energy estimate — increasingly complemented or replaced by ground-based LiDAR and SODAR remote sensing.
Generic templates exist from industry bodies, but the PDF that matters is project-specific: the wind resource, layout, and financial reports a real development produces. When the analysis sits on one platform, those reports export consistently and traceably rather than being assembled by hand.
Designing a wind farm in 2026 is a disciplined, eight-stage sequence in which each stage feeds the next — and the costliest mistakes are the ones that force you backwards through it. The single most valuable thing you can do next is treat the early stages, constraints mapping and wind resource assessment, as the foundation they are, because every layout, yield, and financial number downstream inherits their quality. If you want to see how the whole sequence runs on one model instead of across disconnected tools, request a demo of the Vind platform.
To get the newest product updates, case stories and news releases, sign up for our monthly newsletter.
Please reach out if you are interested in seeing a demo, asking a question or sharing feedback.