
Wind resource data is the single most important input in any project's energy yield estimate and, therefore, for its IRR. But better data has a cost, and the right time to invest in it depends on where you are in the development process and what your site looks like. Here’s a practical guide to making that call.
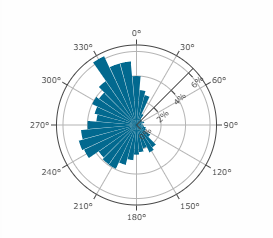
The wind resource describes wind speeds and directions at a location over time, typically visualised as a wind rose showing the frequency and distribution of wind from different directions. This gives developers a first read on how the site behaves—which direction the wind predominantly comes from, how variable it is, and what the speed distribution looks like.

All of this information is available in the Yield Dashboard in Vind AI. But the reason it matters so much goes beyond the visualisation: below rated wind speed, power production scales with the cube of wind speed. A 2x increase in wind speed means 8x the power output. Getting the wind speed statistics wrong, even modestly, is therefore a significant driver of uncertainty in your production estimates and, ultimately, your IRR.
In Vind AI, you can use open mesoscale datasets, upload your own, calibrate spatially and generate WaSP grid files. Or you have the option to order more detailed datasets, like those from Norconsult Kjeller Vindteknikk. For many projects on relatively flat terrain, the open sources are sufficient—turbines across the site will experience broadly similar mean wind speeds, and the uncertainty is manageable.
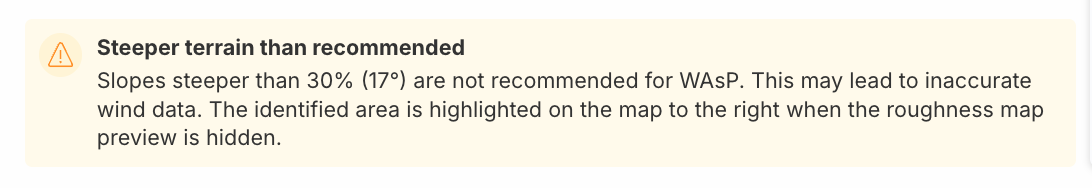
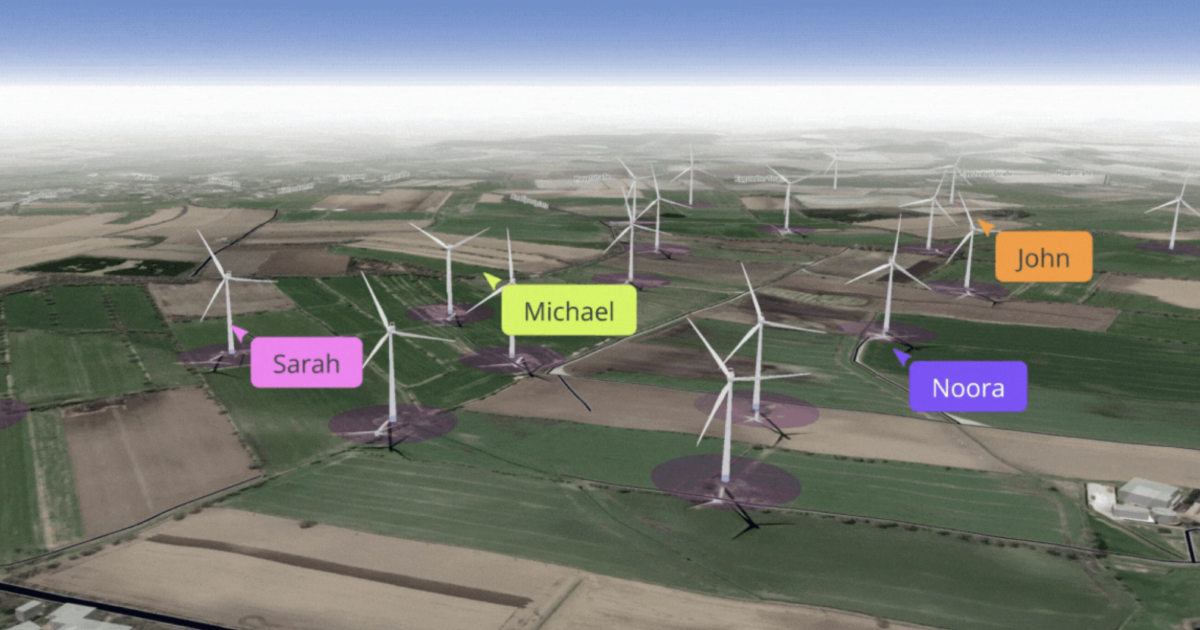
Very complex terrain is a different story. WaSP, which is integrated into Vind AI, is a great option for many terrains; however, when there are slopes steeper than 30%, more data (and in some cases additional expertise) is needed. New wind farms are increasingly being developed at higher altitudes, where wind resources are stronger, but where the terrain also creates significant local variation in wind speed and direction. The wind rose you’re working with may look reasonable at the site level, but at the turbine level, the picture can be quite different.
In this more detailed wind dataset, more of the terrain effects are captured. Here, each colour indicates one spatial data point in the different datasets, and the dataset configurations are shown in the upper left. Having higher resolution data really helps resolve the terrain!
There are two practical signals to watch for:
The first is terrain complexity itself. If your site sits in elevated or rugged terrain, you should assume your open-source wind data carries a higher uncertainty, and you must plan accordingly.
The second is disagreement between datasets. In Vind AI, you can use the Compare functionality to run your project across multiple wind data sources simultaneously and see how average wind speed and energy production vary between them. If the numbers diverge significantly, that’s a strong signal that the uncertainty in your current estimate is high enough to warrant a closer look.
An important nuance: higher-resolution wind data will not necessarily raise your P50 energy production estimate. What it does is reduce the uncertainty band around that estimate. In practice, that means a higher P90: the production level you can expect to exceed 90% of the time, and the number lenders and investment committees focus on for bankability.
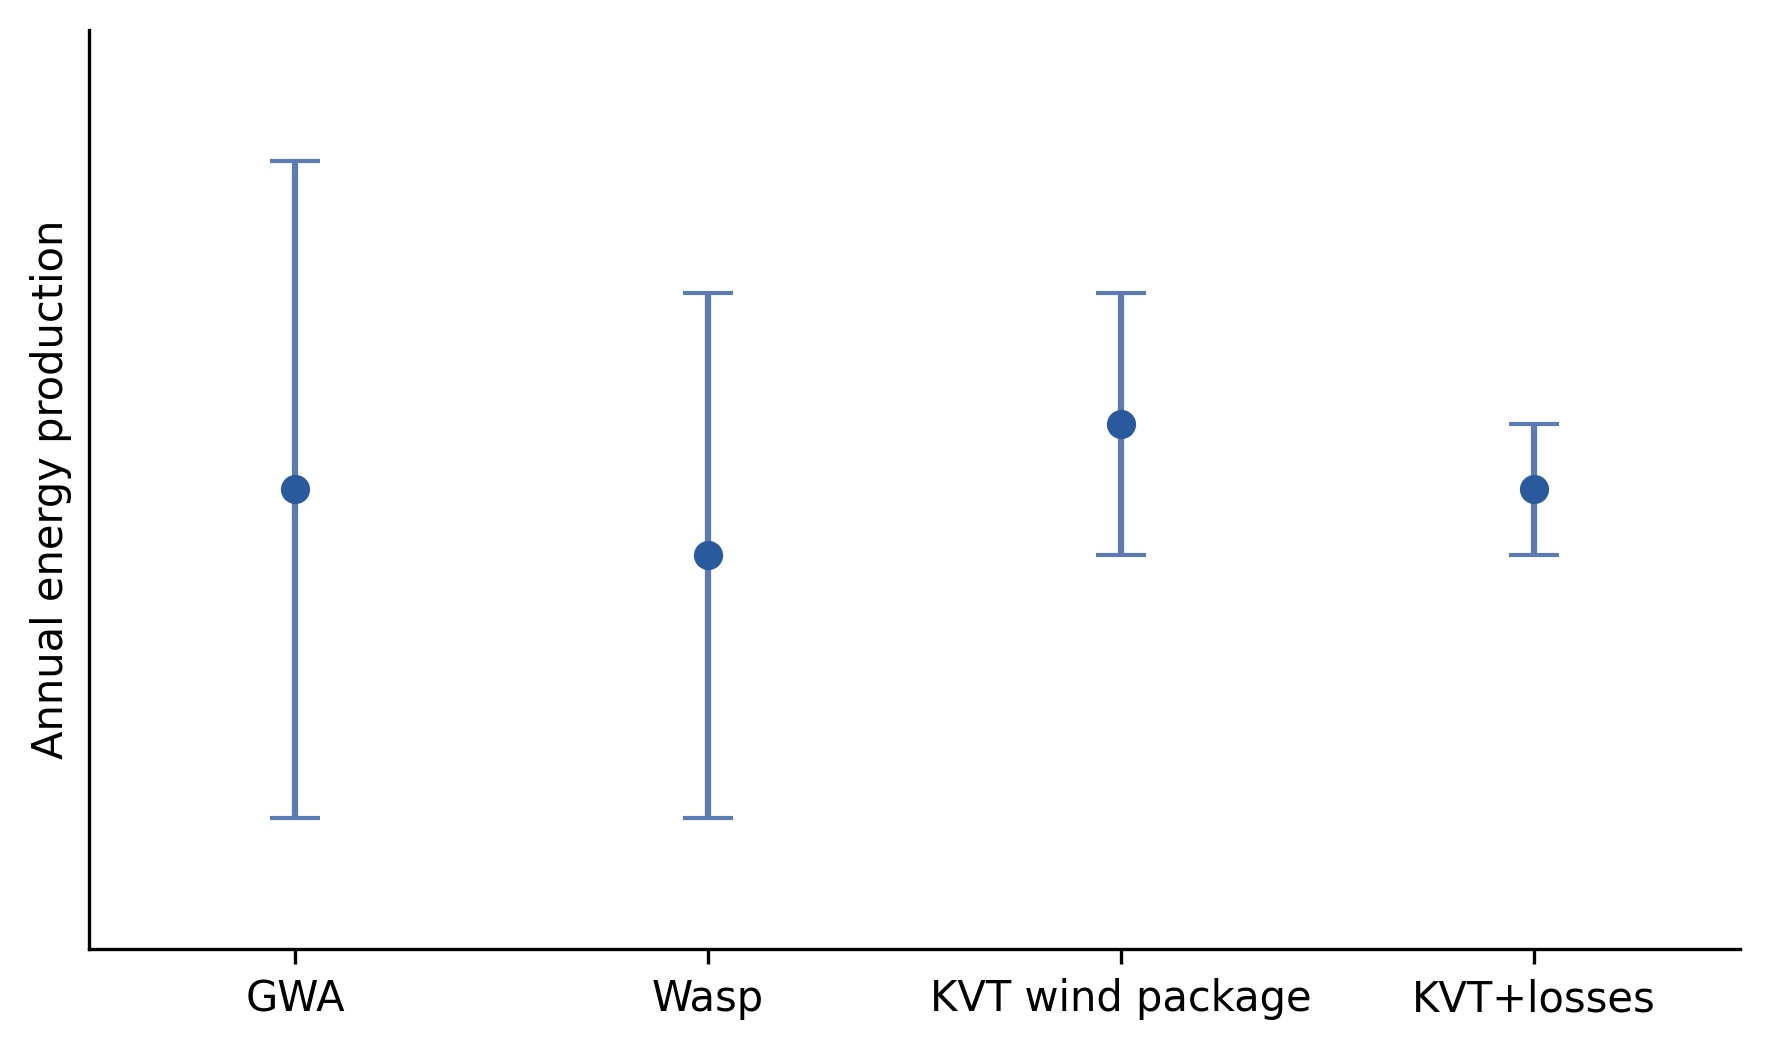
GWA = Global Wind Atlas | WAsP = GWA + WAsP terrain correction | KVT wind package = Norconsult Kjeller data | KVT + losses = KVT wind package + site-specific loss accounting
Tighter uncertainty means more confidence in your business case, earlier. That has direct value at investment decision gates, and reduces the risk of late-stage surprises. Eventually, the project will need measurements for bankability, but investing in higher-quality wind data at an earlier stage will reduce the uncertainty.
At the early screening stage, open datasets are often the right tool. There are other factors—regulatory constraints, grid access, road access—that can kill a project faster than wind data uncertainty, and it may make sense to understand these better before investing in higher-quality data.
As a project passes key milestones and the financial model becomes more critical, the calculus shifts accordingly. At that point, tightening the uncertainty in your project has a direct impact on the robustness of your business case. For complex terrain sites, especially, investing in better wind data early will give much more confidence in the layout optimisation, production estimates and noise calculations.
Norconsult Kjeller’s wind data and expertise are available directly through Vind AI. If you’re assessing a complex terrain site and want to understand how much your current data uncertainty is affecting your business case, we suggest starting with the Compare tool as a good first step.
You can schedule a complimentary meeting with Kjeller Vindteknikk about the wind data at your site directly from your project in Vind AI.
About the author, Norconsult
Norconsult is a leading pan-Nordic interdisciplinary consulting firm combining engineering, architecture and digital expertise across projects of all sizes, for private and public clients in infrastructure, energy and industry, buildings and architecture. Headquartered in Sandvika, Norway, Norconsult’s delivery model is centered around knowledge hubs and local presence through approximately 7,200 employees across more than 140 offices in Norway, Sweden, Denmark, Iceland, Poland and Finland. Over the last 25 years, Norconsult Kjeller Vindteknikk has delivered analyses to more than 500 clients in the wind industry, including project developers, utilities, investors, manufacturers, national governments and financial institutions.
To get the newest product updates, case stories and news releases, sign up for our monthly newsletter.
Please reach out if you are interested in seeing a demo, asking a question or sharing feedback.