We’re back with a wave of powerful new features, designed to help you model more precisely, move faster, and get even more value from Vind AI. Here's what's new:
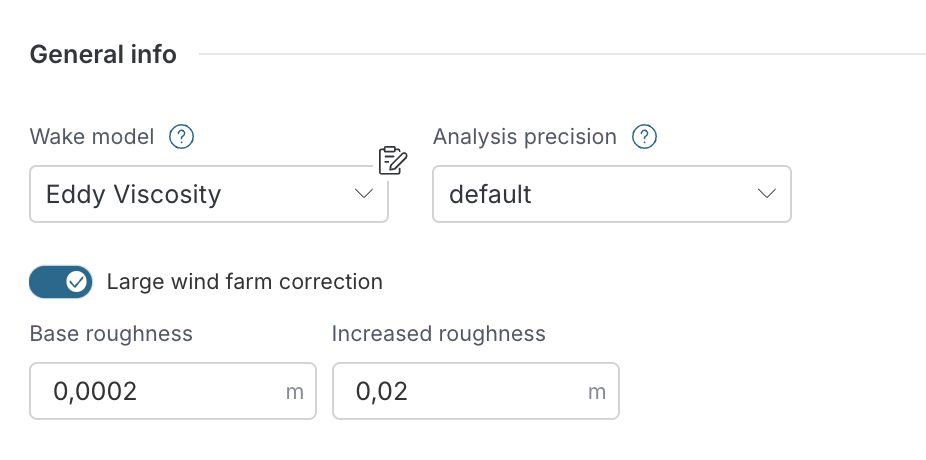
We’ve released the Ainslie eddy viscosity wake model, a widely used option in early-stage planning, a valuable complement to our existing industry standard wake models, Jensen (Park 2) & TurboPark.
The new addition includes:
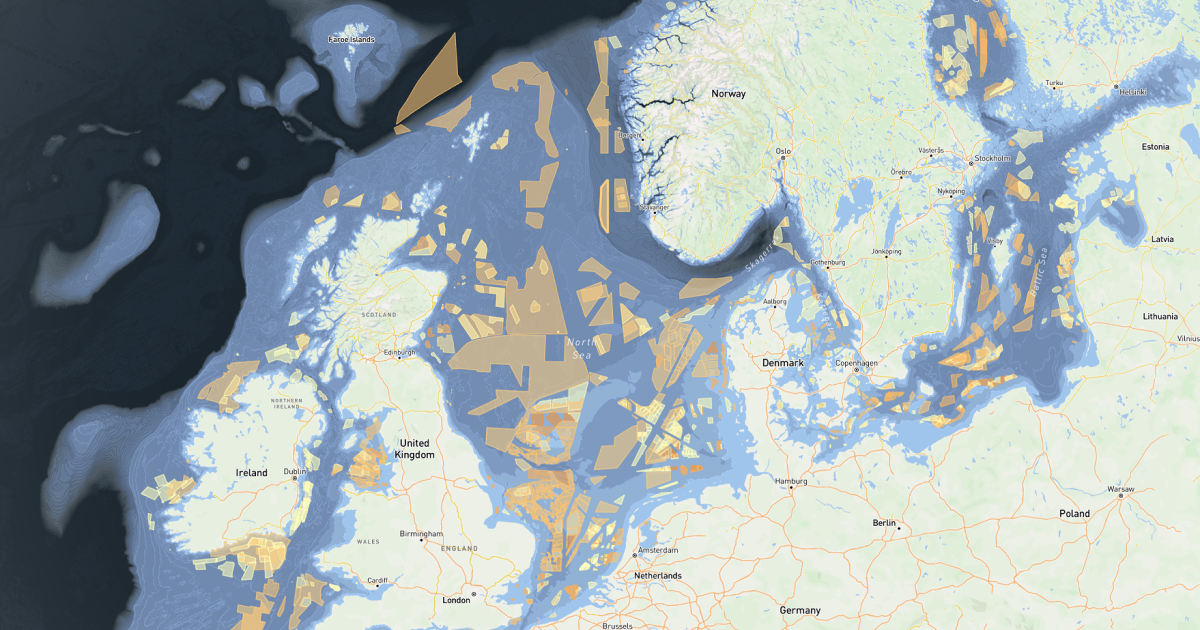
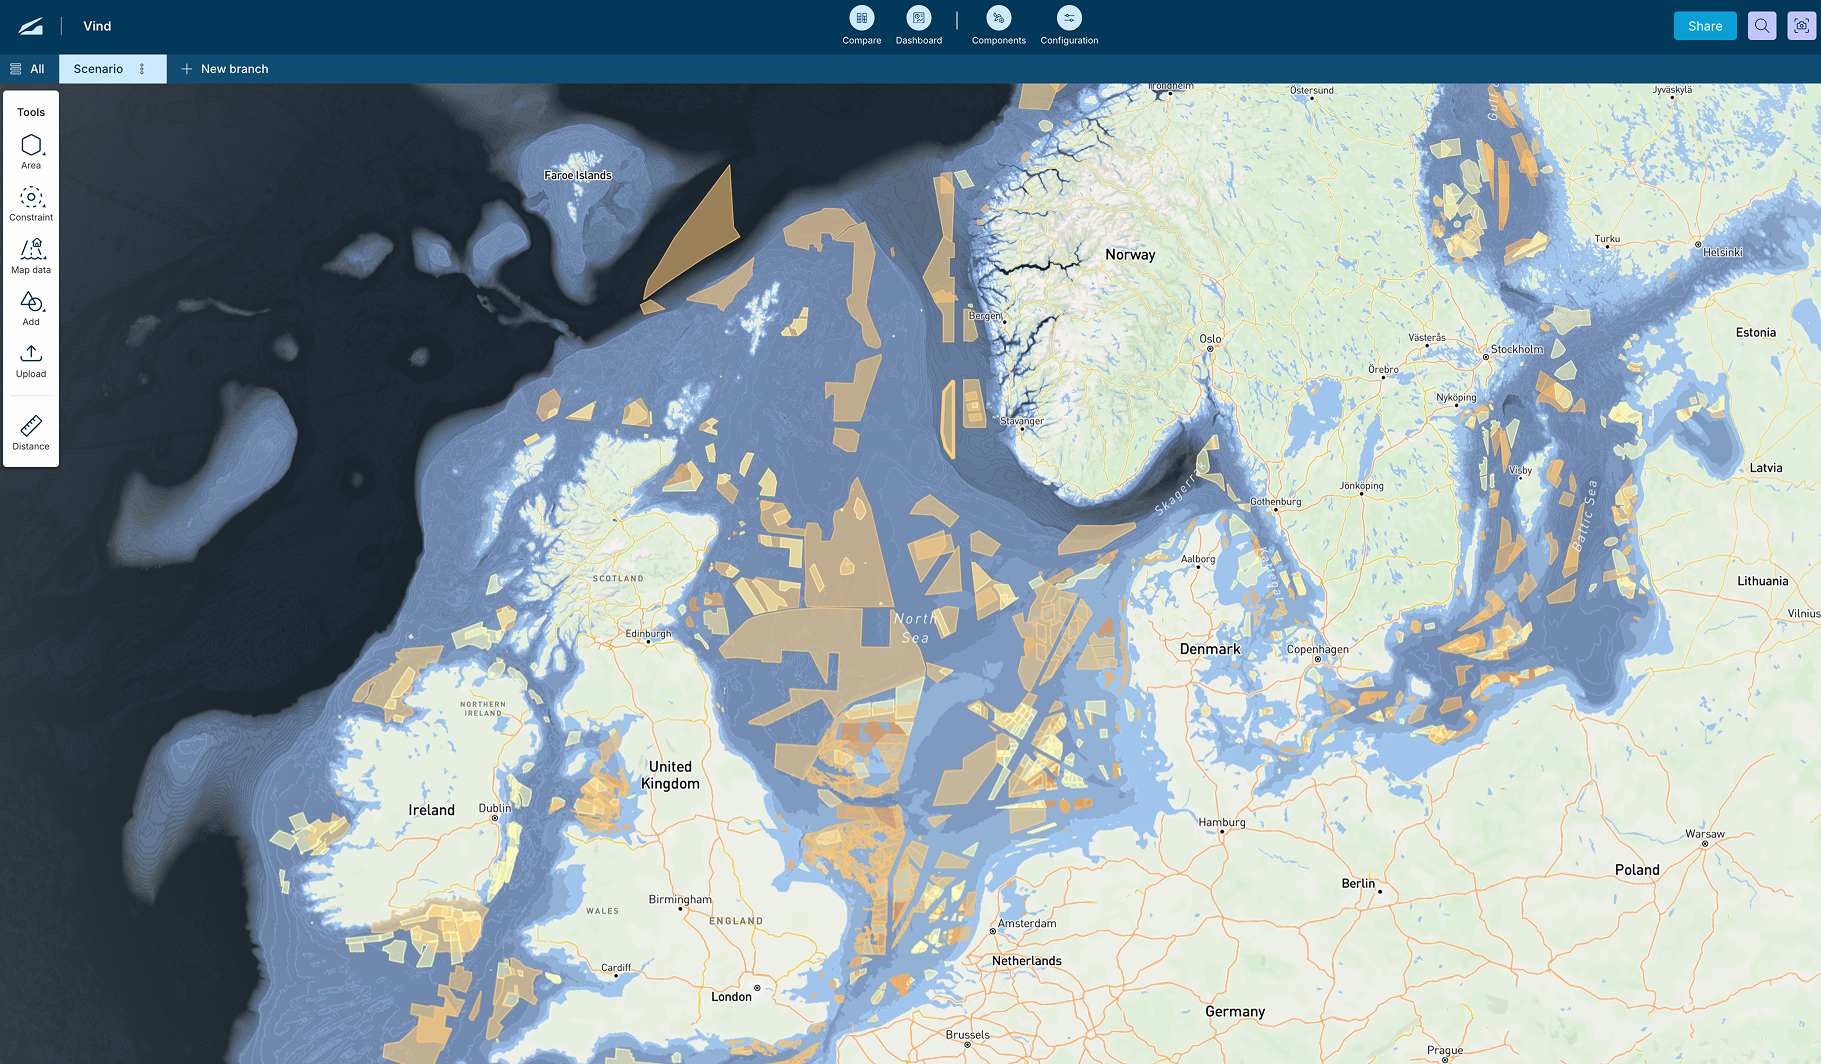
With Vind AI, you can easily centralise all the GIS data you need for your wind projects, anywhere in the world.
Upload your GIS data to the platform—or connect to external geospatial data sources directly via Vind AI, including:
Every time you use it, data is fetched directly from the source and updated, so you know your team will always work on the latest version, eliminating errors caused by outdated files.
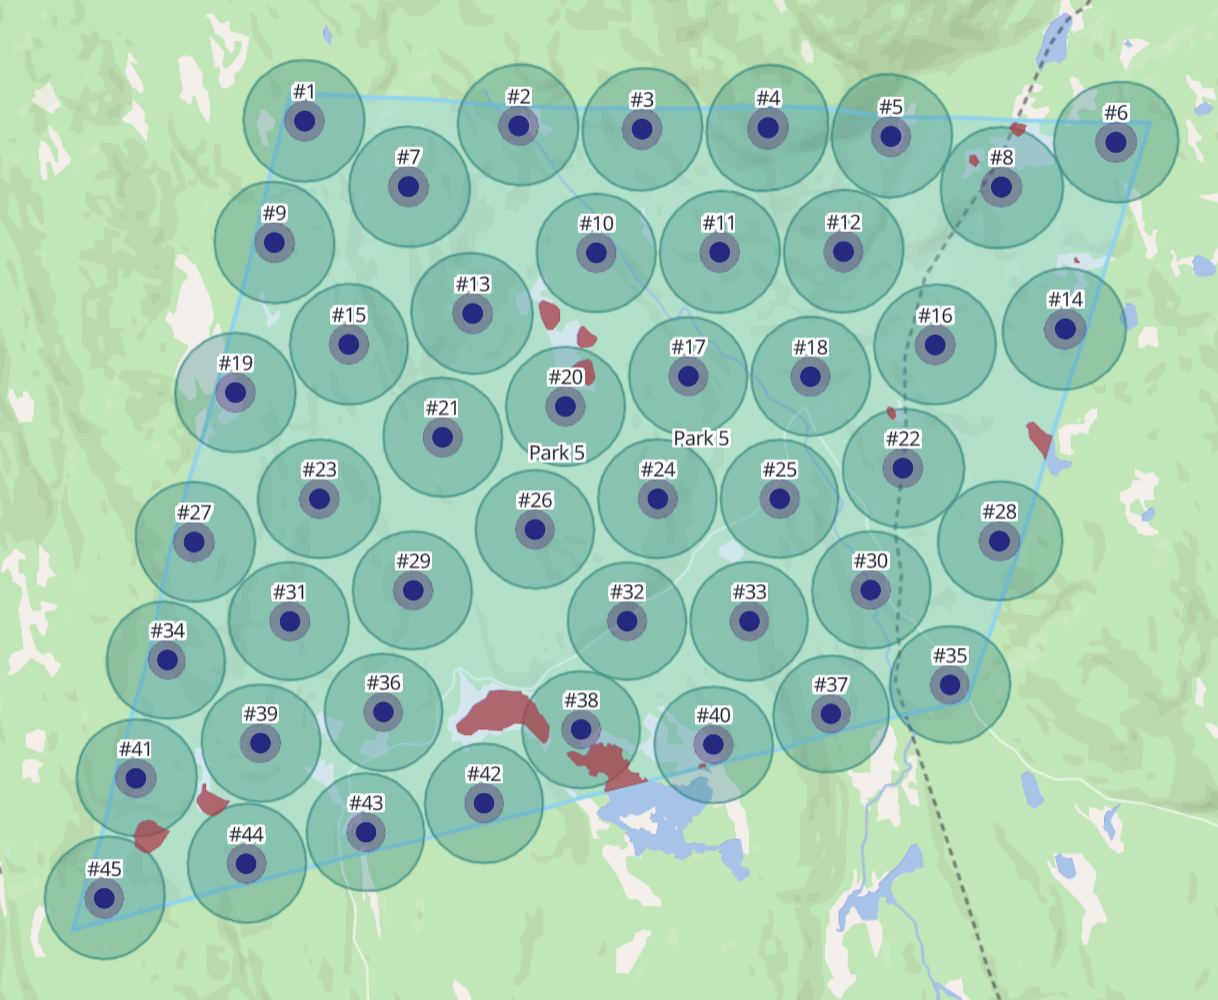
We’re excited to introduce a new optimisation method, suitable for when you don’t have a fixed capacity or predefined number of turbines. You can now use the new ‘Fill area’ optimisation to calculate how many turbines can fit within a given area based on the minimum spacing requirements. Additionally, you can set a maximum wake loss limit. In that case, the method will find the largest number of turbines that can be placed without exceeding the specified wake loss threshold for any of the placed turbines.
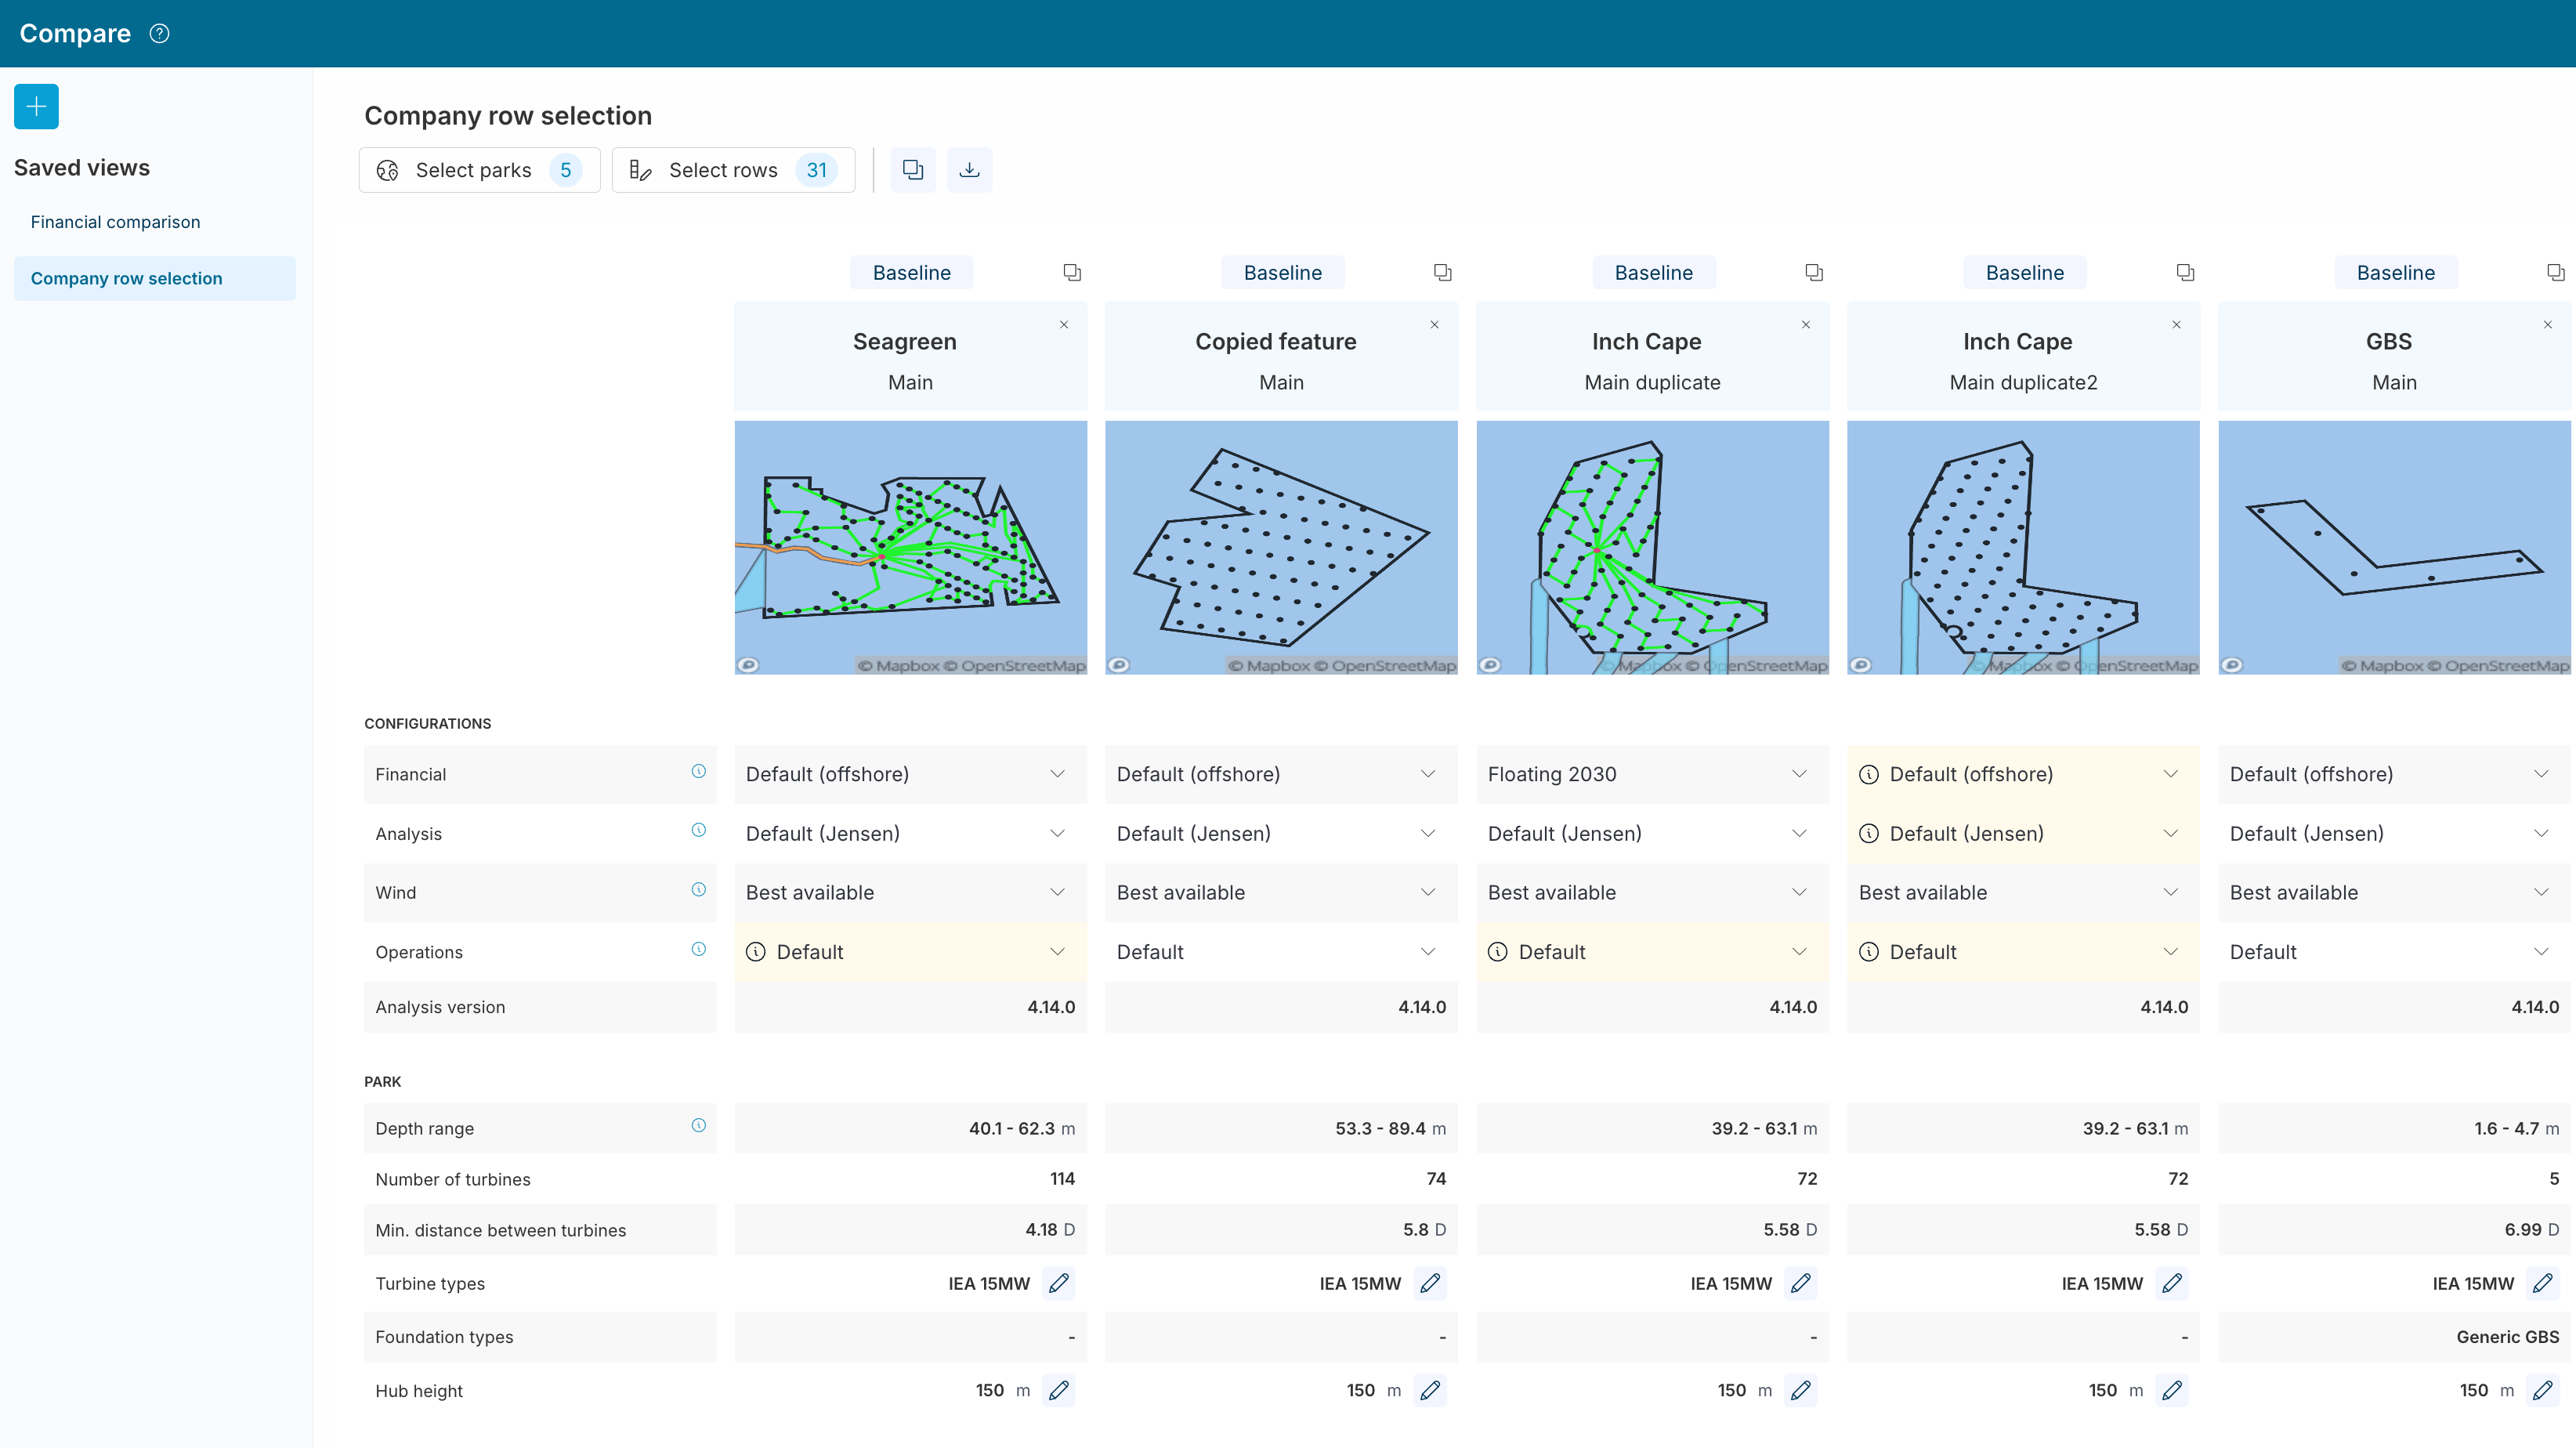
Have you ever wanted to create multiple comparisons in the Compare function? It's now possible to save and manage multiple comparison views. Each saved view appears in a list for easy access, and when editing you can decide whether to update the current view or create a new one. It’s also simple to delete, duplicate, or share views with a link. This update makes comparisons more flexible and collaborative than ever.
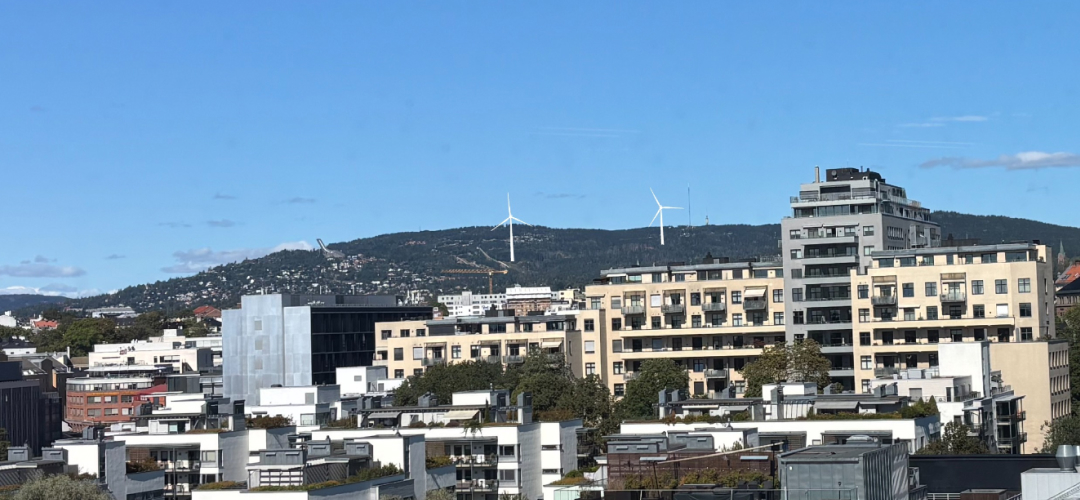
With the new photo montage functionality, you can create realistic visualisations of future wind farms by combining site photos with 3D turbine renders.
Simply upload a photo, align it with the virtual scene using scaling, rotation, tilting or reference points, and then touch up the image to account for buildings or terrain. The result is a clear, real-world view of how planned turbines will appear in the landscape, perfect for project communication and stakeholder engagement.
Working on onshore infrastructure? Big improvements just landed:
Now you can switch from auto-generated roads to a manual method, adding waypoints or new road segments wherever needed. Or go fully manual and draw your own.
We have now made it even easier to take electrical losses and cable costs into account in your onshore wind farm planning. Use the inter-array cable generation to create a layout, and find the shortest path between the turbines and the substations along the road network, in order to minimise cost and losses.
Together, these changes make routing more realistic and visual than ever.

You can now model GBS foundations, large concrete bases that rest on the seabed, directly in Vind.
As GBS gains attention for intermediate-depth sites, you’ll be ready to explore and evaluate this option.
You can now store and manage wind configurations in your organisation’s library, making it easy to reuse setups across projects. This is a great way to define company-wide defaults or template configurations, helping you save time and ensure consistency.
With this new integration, you are now able to get more accurate market price estimations directly in your financial configuration, making it even easier for you to make more informed investment decisions.
By fetching data from Thema, you can select a single-year capture price for any European economic zone as the starting point for your financial analysis.
For deeper insights, you have the option to purchase the full time series of market data from Thema directly within the platform.
Our new data partnership with Thema adds to our existing partnerships with DTU (the Technical University of Denmark)’s WAsP predicted climate data and Norconsult’s Kjeller Vindteknikk’s local wind data, with many more to come.
Reach out to us or request a demo to try out Vind AI for yourself!
Please reach out if you are interested in seeing a demo, asking a question or sharing feedback.